Order Digital Reprints
Sign Me Up!
Sign up Digital!
Subscribe to Print!
Interested in Manholes?
Get Manholes articles, news and videos right in your inbox! Sign up now.
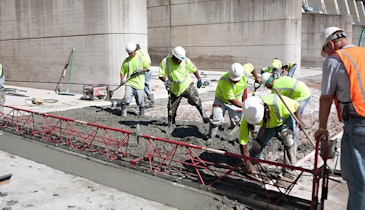
Manholes + Get AlertsKnowing that an underground asset travels between Point A and B is not the same as knowing where that asset is as it makes its way between those two points. True, the entry and exit manholes are clues, but the route of travel, its depth below grade, slope and turns, are only suggested by the manholes’ surface positions and elevations.
Owners must keep track of each asset segment’s location for maintenance purposes and to avoid conflicts with new assets, proposed adjacent installations or nearby maintenance regardless of who is undertaking the work.
These issues are concerns for sanitary and storm sewer infrastructure as well as similar underground conduits and pipelines. All of these conduits may be expected to follow a particular route, at a specific depth and with defined slope characteristics – but actual installation does not always agree with expectations.
Well documented, described and archived CCTV inspection data can pinpoint defects anywhere along a segment’s length. Bringing the defect’s location “to the surface” to facilitate pinpoint excavation is an essential prerequisite for conflict-free repairs. Call-before-you-dig clearances are only as accurate as the data that supports the markouts.
The CUES AMP (Accurate Mapping Probe) generates, stores and depicts asset data, empowering owners to locate, document, understand and see those assets in real time on a Google Earth Map. Other graphic reports allow the user to see the section as it twists, turns, rises, falls and sags.
Data access is as fast or slow as the user’s Web browser or, if stored locally, a laptop, desktop or tablet.
The AMP was demonstrated in a verification track near CUES Mapping Service’s office in Bridgeville, Pa. The track is assembled in a field from common 8-inch PVC placed in cradles. Running above ground so that the track rises and falls with the terrain’s surface characteristics and bends from left to right, the track simulates a buried 8-inch conduit. Before traveling to the site, a check of Google Earth clearly revealed the pale blue verification track (pipe).
Operations managers Chris Carlin and Pete Monday and data management specialist Brian Weitzel demonstrated the AMP both in the field and in their nearby office. The office was a substitute for a maintenance vehicle or pickup truck’s tailgate, all of which work quite well.
Walk around
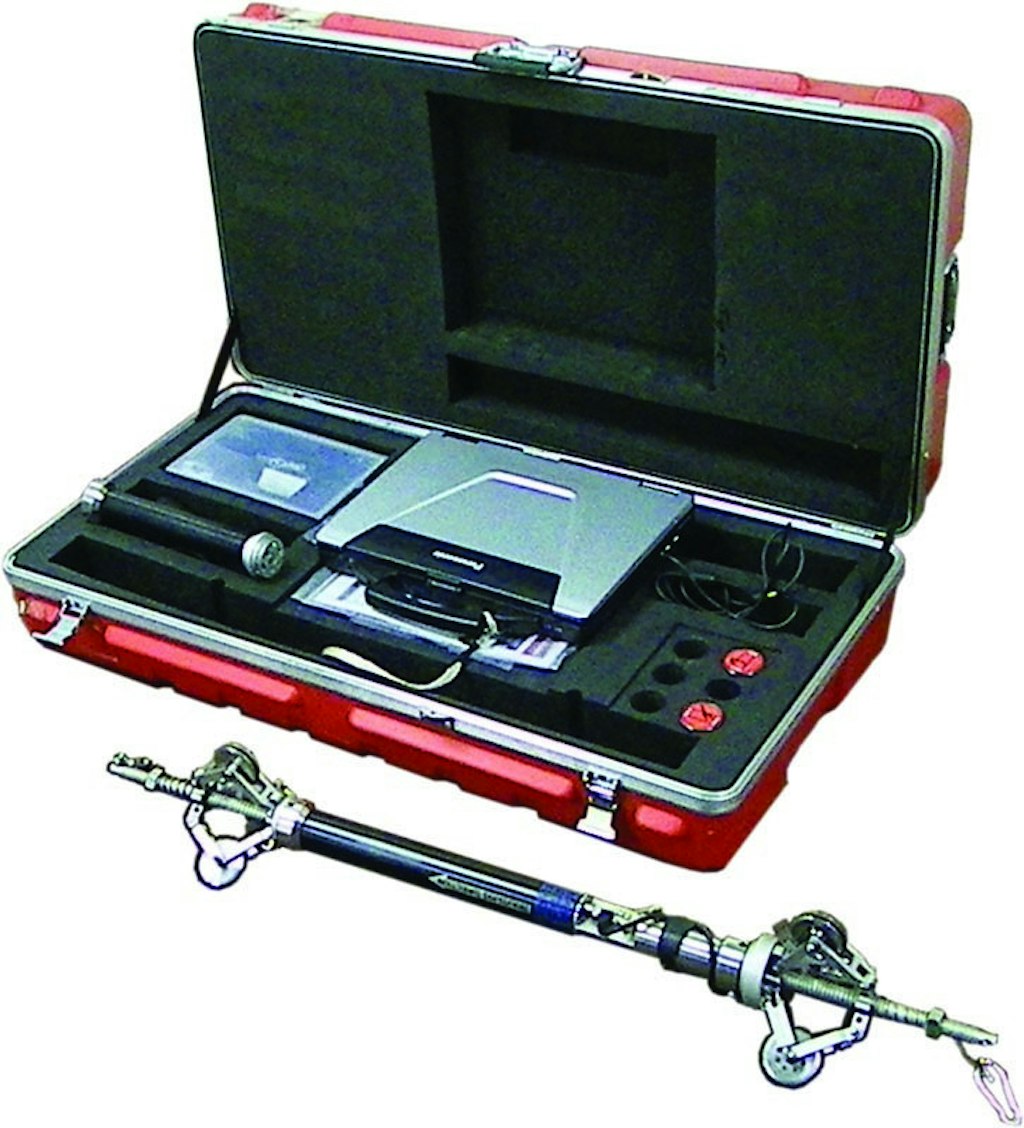
The AMP and all required supporting accessories are shipped in a single, impact-resistant travel case. In addition to the AMP are wheel sets, a laptop computer, three batteries, a charger, a pair of on-off switches and an Ethernet cable.
Each AMP is paired with a one-to-one synchronized, hardened, field-grade laptop. The laptop is not used during the conduit traverse but is used in the field to do a quick data QA check before a work crew leaves one section to map another.
The AMP is produced in three basic configurations. The differences are in the housings provided, as they are intended for different conduit diameters. The two larger models are black metal cylinders about 2 inches in diameter that fully contain the sensors. These models can be fitted with a variety of wheel sets. The AMP can survey conduits from 3 1/2 inches through more than 96 inches in diameter.
The different wheel sets and mounts enable the AMP to follow twists and turns in larger-diameter conduits. The smallest model, however, does not utilize centralizing wheel sets. It has a smooth exterior and is articulated, not by hinges but by the use of flexible metallic woven cloth that, with additional impervious inner layers, provides both flex and watertight integrity. This model, held in the center of the conduit by centering spacers, can travel through conduits as small as 1 1/2 inches. The articulation allows the unit to navigate turns as tight as a 90-degree sweep with a radius of least twice the conduit diameter.
Matching the twists and turns to distance traveled is accomplished through the data gathered by a wheel-mounted odometer.
All three models perform the same functions. From a known starting point, as the AMP moves through the conduit, it is recording its linear progress forward or backward. Every shift in angular direction, left or right and up or down, is recorded. These recordings are achieved through the use of gyros, inclinometers and accelerometers. Data readings, 100 per second, are recorded on an internal flash drive.
The cylinder holds an internal battery with a 2 1/2- to three-hour field life. Batteries can be swapped out in the field to support a full day’s work.
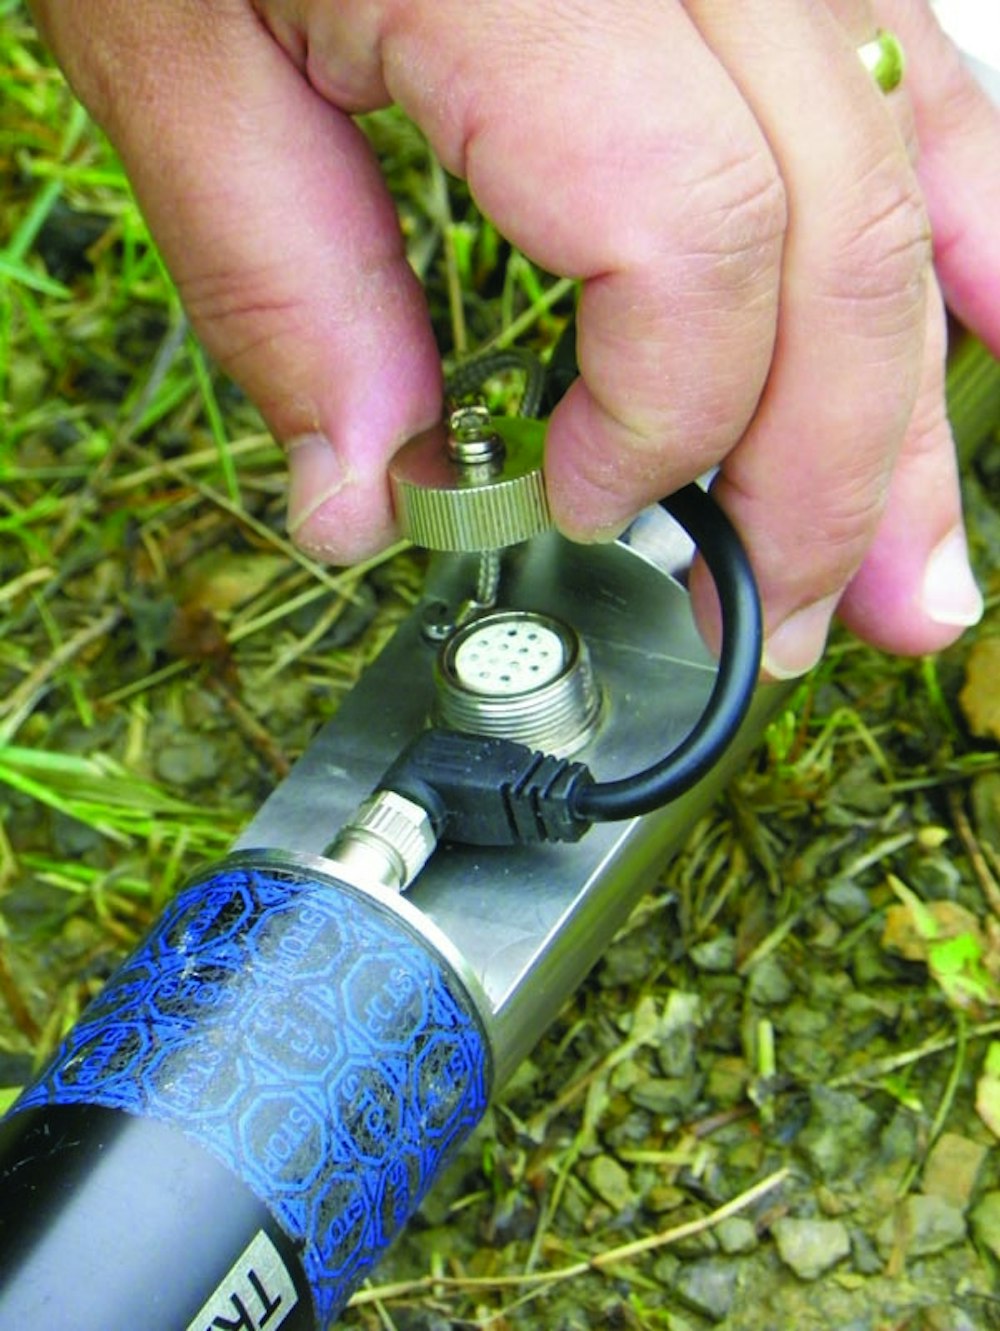
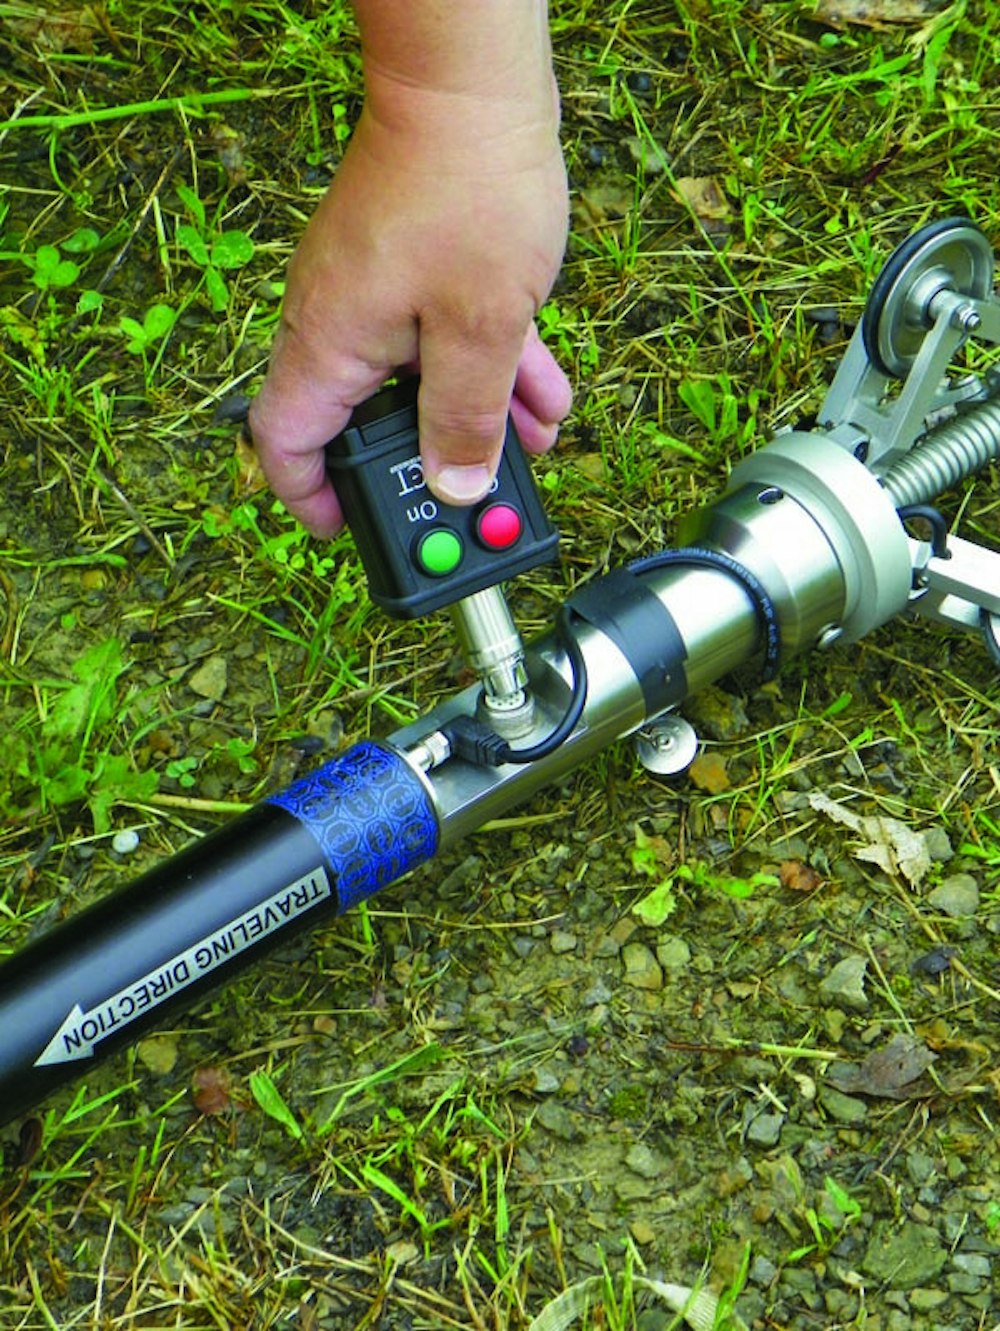
An external, removable start/stop switch is used to power up and power down the AMP. It is screwed onto a jack for use and removed until needed again. A tethered, watertight cap is provided for use when the switch is not in place.
Both ends of the AMP are fitted with a loop that resembles an eyebolt to attach a carabiner clip. These are needed because the AMP is neither self- nor tractor-propelled. Pulling is the standard method for moving it through a conduit. Because the AMP will traverse each section twice, it must also be tethered so that it can be retrieved or pulled backward through the section.
This means that before the AMP can be introduced, a pull cord must be inserted in the conduit at the destination access point and exit at the introduction access point. Then, connected by two tethers, one fore and one aft, the traverse can begin.
The AMP can be pulled in both directions by an Armstrong mechanism or by a mechanical cable system. In both cases, a relatively constant velocity with a minimum of “bursts of movement” is preferred.
When the AMP has made forward and reverse traverses, the external on-off switch housing is used to connect a CAT 5 Ethernet cable to the laptop. The data is downloaded from the internal flash drive to the hard drive and the cable is disconnected.
After the data is run through several validation tests, and if the data satisfies the required performance standards, work moves to the next access point.
If there is adequate cell network coverage in the field, the data can be sent to the Web where another operator can access it, then process it while the field crew continues its data-gathering work.
The demonstration
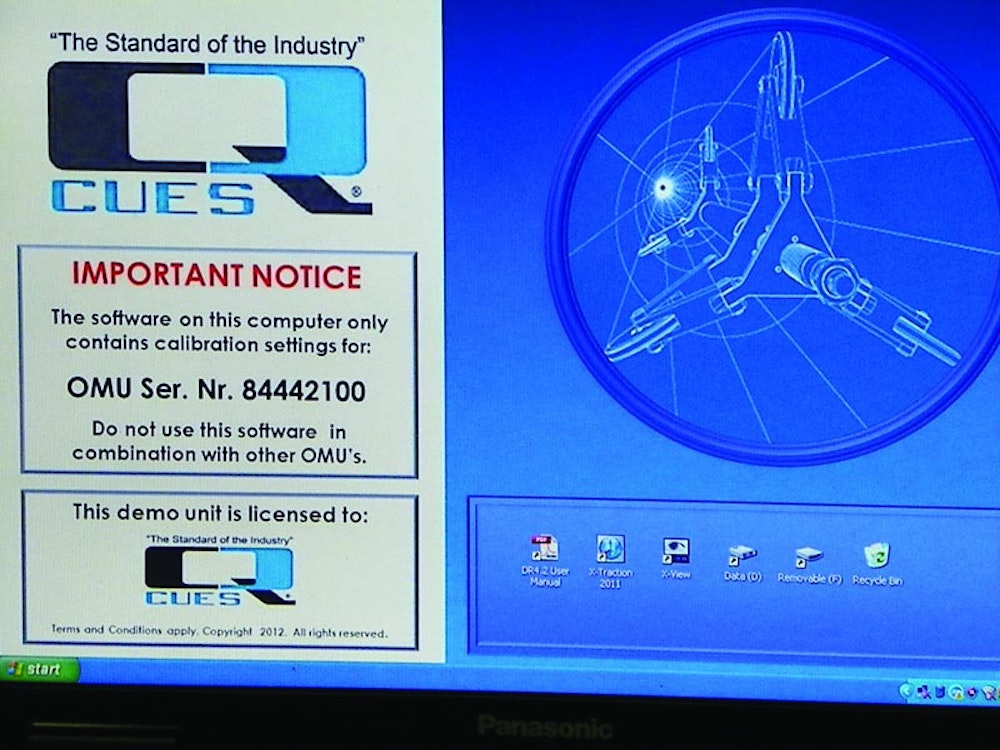
The demonstration began in the CUES office where the contents of the AMP shipping container were explained. Typically a deployment vehicle would be the platform for a prelaunch performance check, but this was accomplished in the office. A wheel set appropriate for the 8-inch pipe was installed.
To enable accurate data plots, the operator enters facility owner and section identifier information. Because wheel circumference relates to distance traveled, the software requires the operator to enter this information. This data set enables the software to correlate or impose distance data on the trace.
Precise longitude and latitude information for both beginning and end point manholes is entered along with elevation data. These previously collected and validated inputs must be tied to a universally recognized horizontal and vertical control grid. This enables precise plotting of each trace.
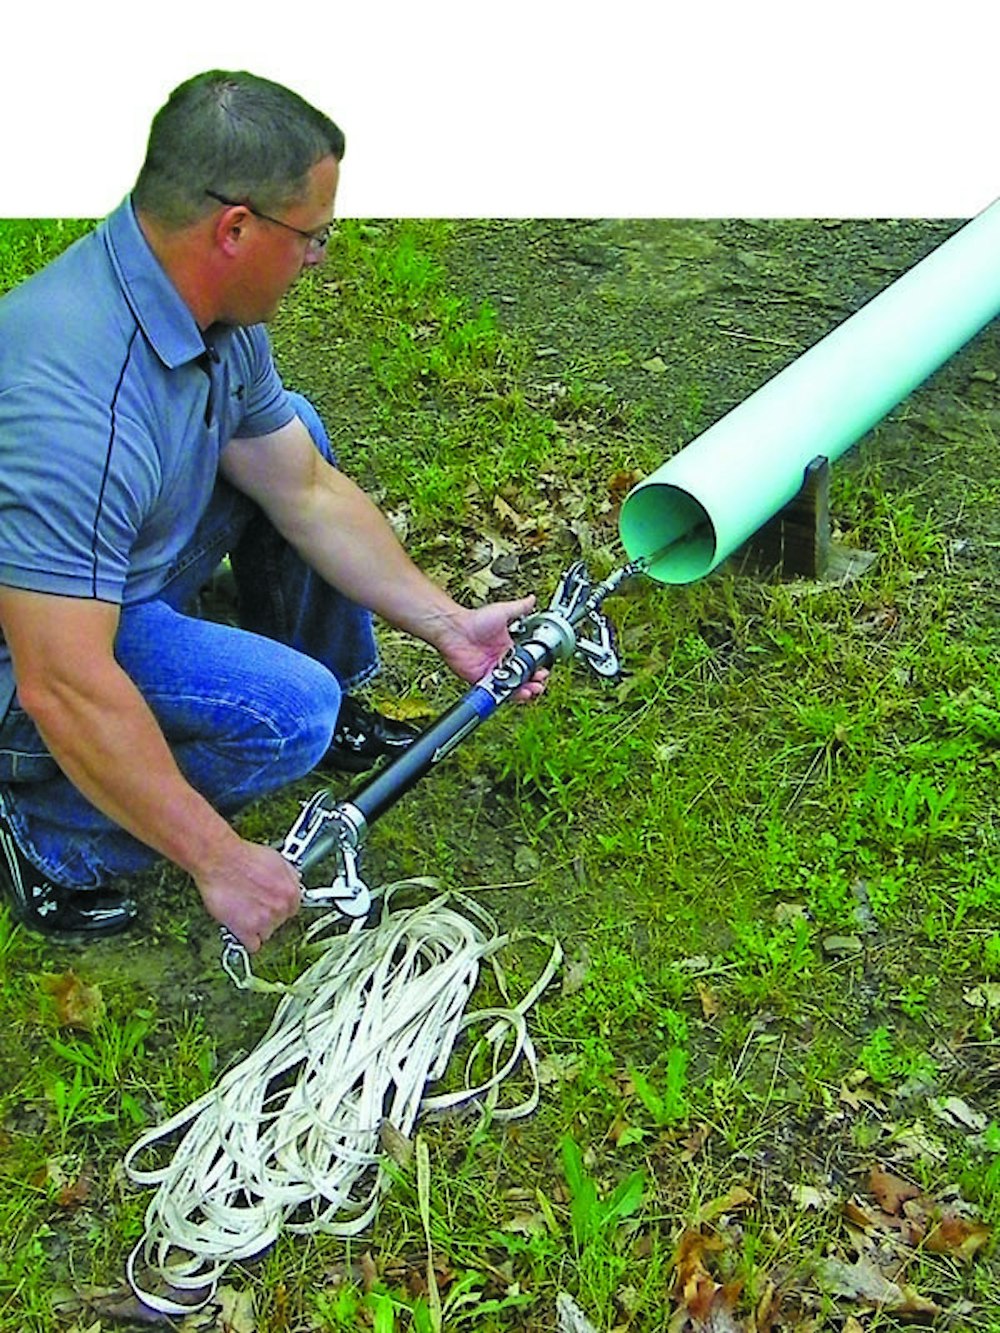
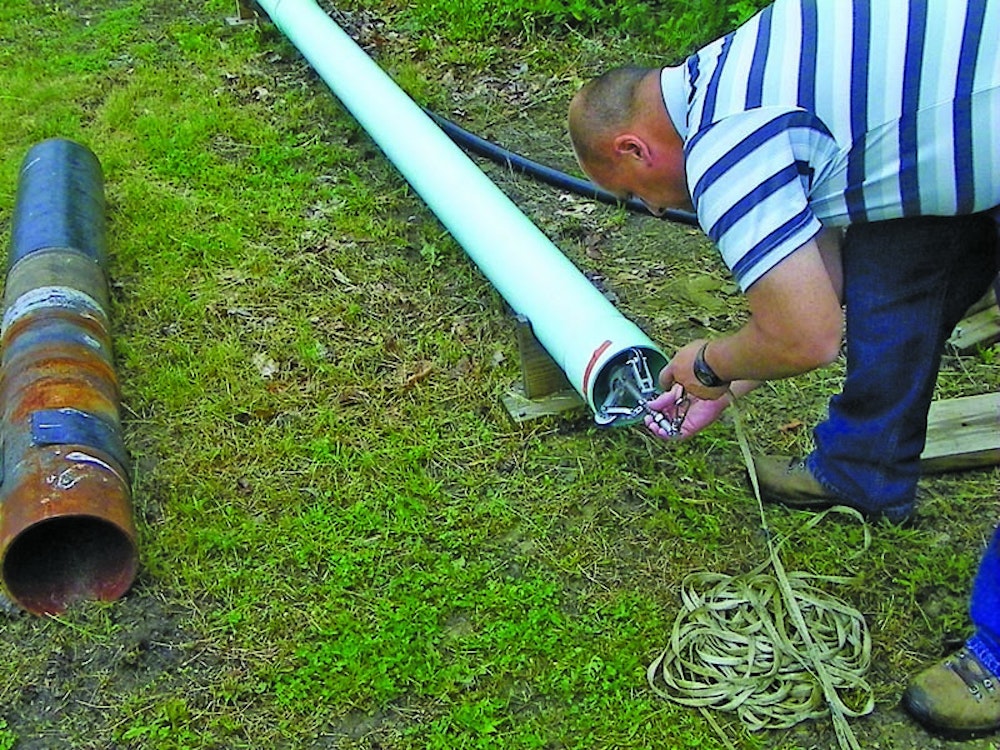
Once the prelaunch preparation was complete, the group walked to the verification track. A pull cord was already in place between the introduction and destination access points. Another cord for retrieval was on the ground ready for use. Both would be attached to the AMP, one to pull it forward, one to pull it back.
Monday inserted the on-off control box and powered up the unit. A pair of indicator lights, one red, one green, signaled all was well. The control box was removed, the watertight cap screwed on, pull and retrieval cords were snapped on and the AMP was inserted into the open pipe end.
Through all this, the sensors were sending data to the onboard flash drive. The AMP was allowed to loiter for about 30 seconds before Weitzel, positioned at the far end of the track, pulled the cord at a uniform pace. Weitzel maintained a steady pulling velocity while trying to avoid jerking the cord. Soon the front carabiner was protruding slightly from the pipe and the pull stopped.
The AMP was allowed to loiter at the end of the forward traverse for about 30 seconds. Monday then began an equally consistent retrieval pull until the AMP reached the origin point. After about a 30-second pause, the AMP was removed.
Had this been an actual field deployment, the operator would have connected the laptop through an Ethernet cable that plugs into the on-off control box and quickly field checked the data in a systematic QA/QC protocol. If the data passes that screening, the device would be transported to the next introduction point where the process would be repeated.
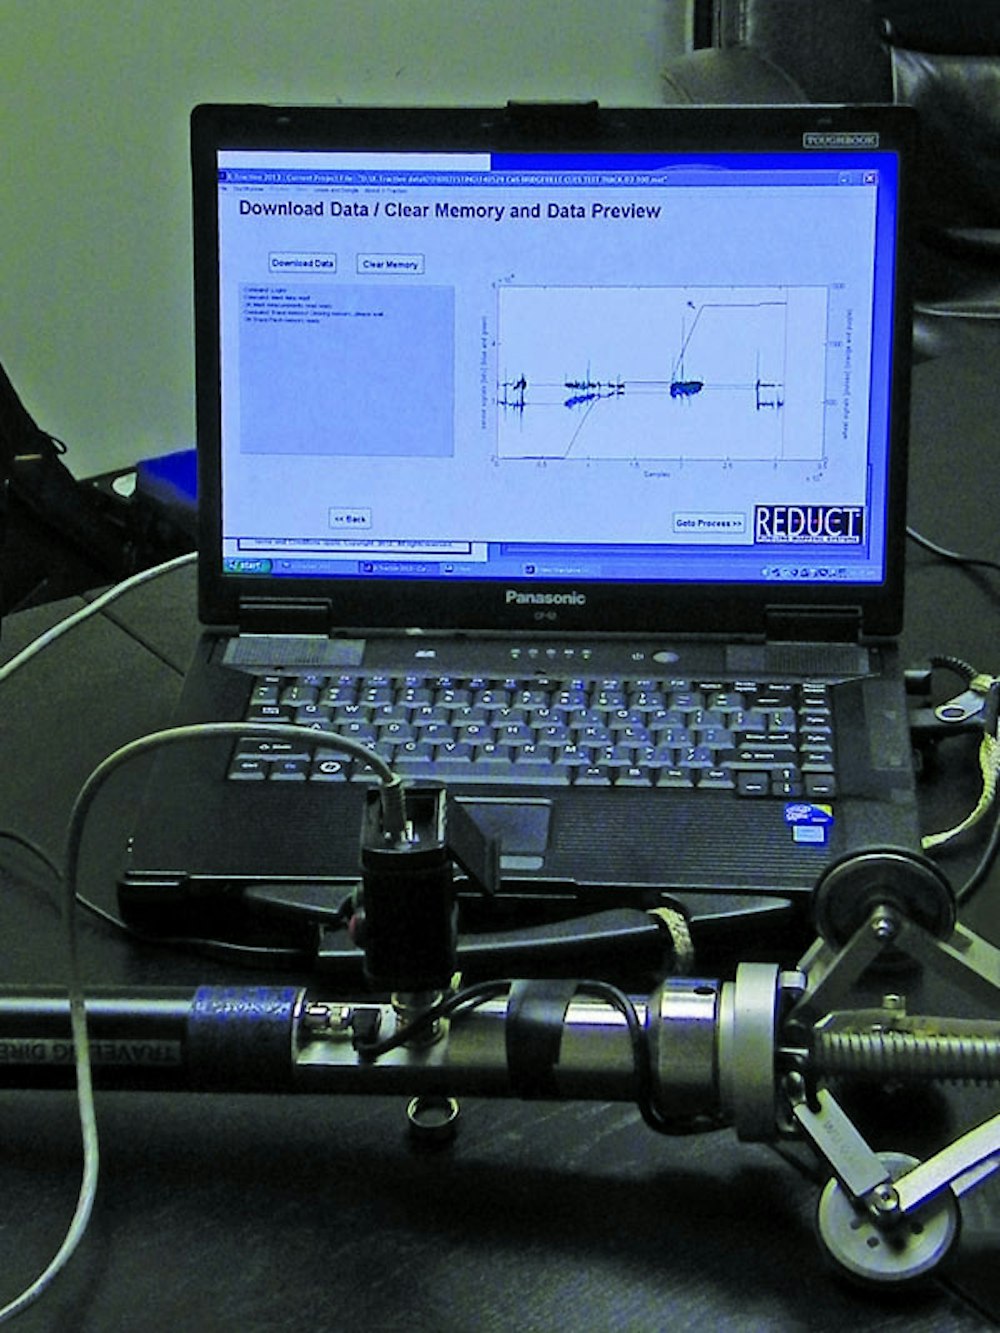
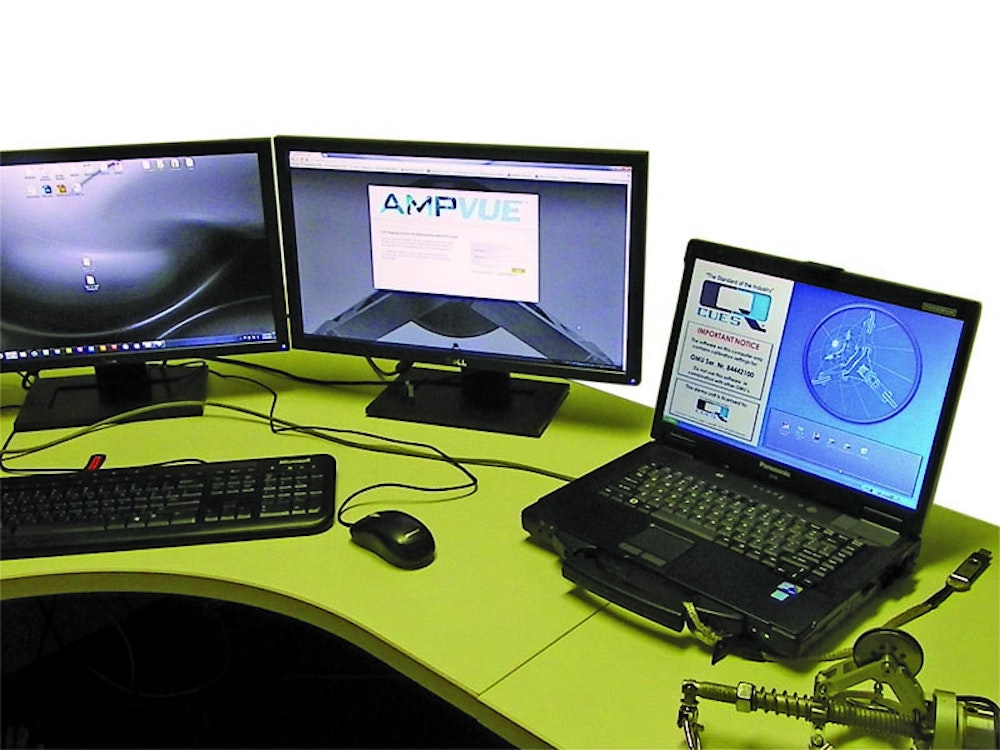
Back on a desk in Carlin’s office, which substituted for a deployment vehicle’s worktable, the AMP was hard-wired to the laptop for data download. The data was next transferred to a desktop computer using a thumbdrive as the transport mechanism. It could just as easily have been moved via a wired or wireless connection.
At this point, the data was redundantly stored on two computers’ hard drives and on the thumbdrive and was ready for field validation, in this case, in the office.
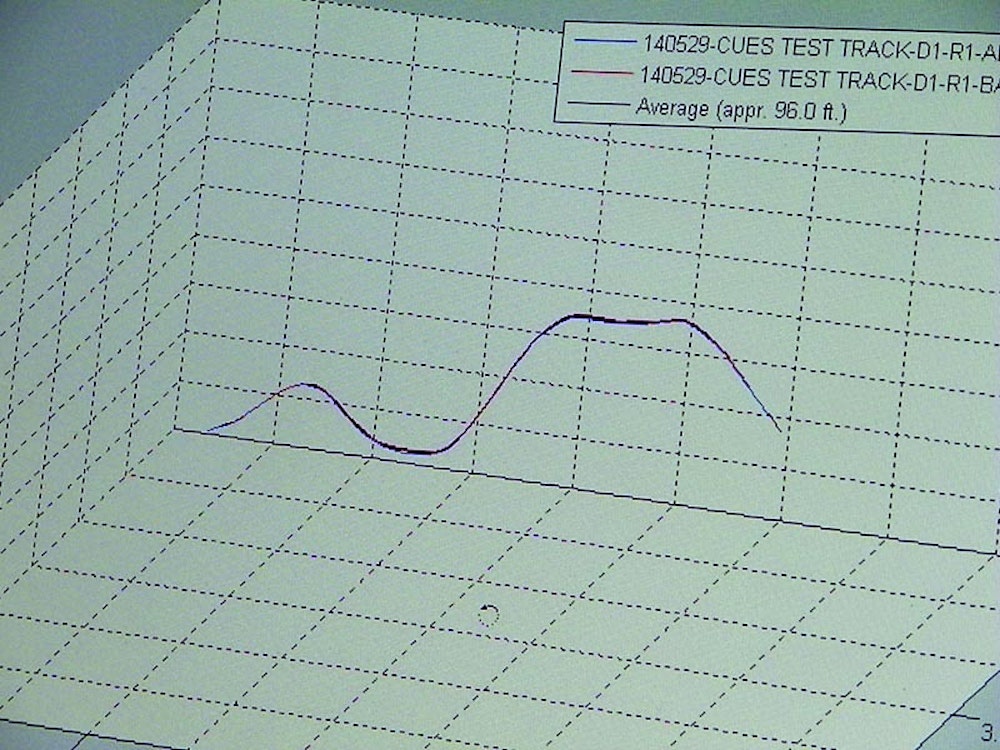
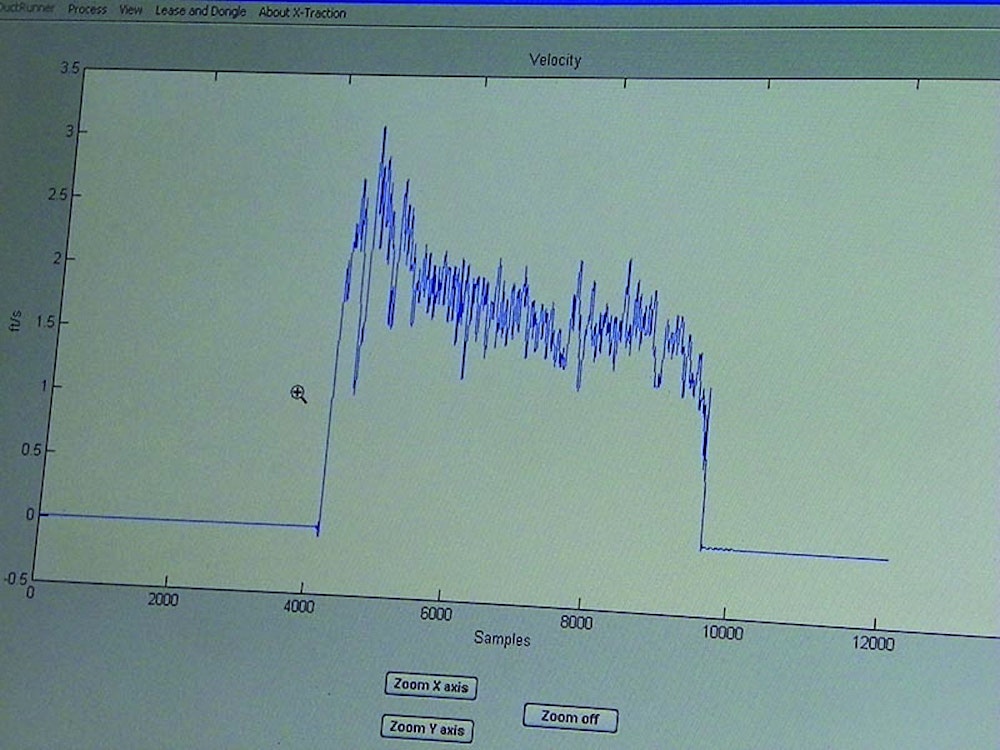
On the laptop, the jagged line trace from the instruments resembled that of a seismograph, except that there were what appeared to be short stretches of “flat line” between jagged graph segments. The uniformity of a background seismic trace or the symmetry of an EKG graph were not seen; rather, the traces were irregular due to the Armstrong pulling mechanism used.
Monday explained that the flat line segments are important markers. “They tell us where on the trace each section’s observation began and ended.” Carlin parsed or cut the data into two sections: forward trek and backward trek.
The first task for the software was to convert all three sensors’ data into a two-dimensional plot. This was done for both forward and reverse traverses. Next, the software performed a “best fit” analysis. This is an average plot derived from the two data sets. The three were imposed on each other and color coded for ease of recognition.
Initially, viewing the data at a scale of hundreds of feet per inch, it appeared there was only one line. As Carlin zoomed in, the scale changed and the three lines were individually recognizable.
Viewing tools allow or automatically display specialized views that highlight instances where the two traces are different. Carlin guided the software to calculate highest, lowest and average point deviations, and he ran analysis to ensure the traces were within allowable tolerances. If the in and out traces were significantly out of sync or one zigged where the other zagged, the traverses could be repeated before moving to another segment.
Each data point is associated with three numbers, each of which identifies its position on an X, Y, Z axis grid. By correlating angular data with distance, in a 400-foot section, the exact position of any point can be located within 1 1/2 inches in three-dimensional space. The accuracy may be diminished by pipe irregularities, inconsistent pulling force or the presence of debris or obstacles.
The data, now on the desktop, can be seen as a three-dimensional “tube.” Using manhole elevations, the ground surface can be generalized and imposed. This helps viewers orient themselves and the plotted data to the real world.
Carlin, using his preferred Web browser, uploaded the data to AMPVUE.com. This website’s tools allowed him to convert the basic X,Y, Z tabular point data to a variety of different formats. Each format meets the specialized needs of a particular user group. Formats include: .csv, .dwg, .dxf, .kml, .pdf, .shp, .xlxs, inclination, line and arc.
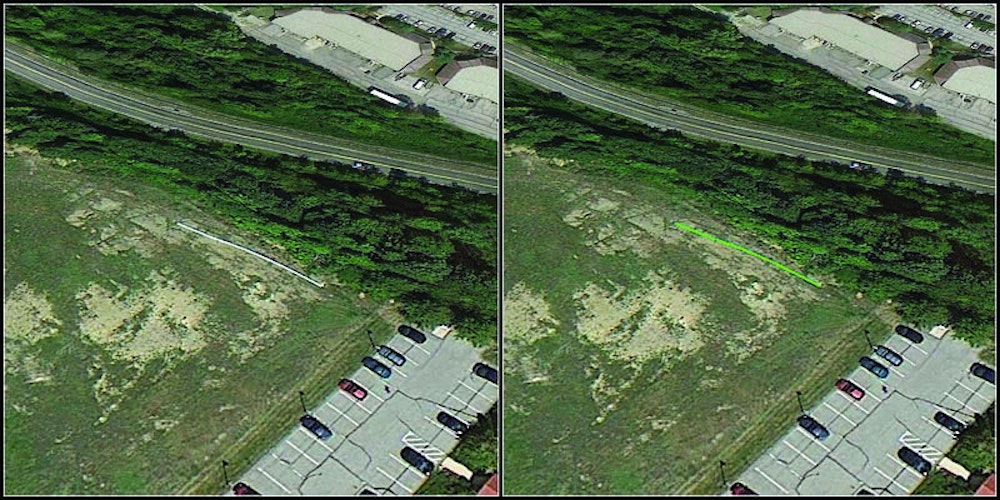
Selecting the .kml data format, Carlin relayed the data file to Google Earth. Next he superimposed the data onto the Google Earth map. As he zoomed into the grassy field where the test track is located, the imposed data was quickly apparent. When he toggled the traverse data off, the test track pipe was plainly visible. When he toggled the data on, the test track traverse was directly on the test track.
Had the test track been an underground conduit, the imagery would only have shown two manhole lids with no visible connection. The traverse would have been imposed on the imagery and would have connected two manholes. Users in the field would be able to visually correlate the data to surface features to locate the manholes. From there, zeroing in on the exact traverse point would be relatively simple.
The total time for data validation, traverse processing, uploading and the Google Map overlay was about 30 minutes.
The data, although available through the CUES AMPVUE.com site, belongs to the user, not CUES. Once downloaded to the user’s server, it can be stored in any number of locations in any of the formats into which it has been converted with CUES’ AMPVUE.
Monday explained that deployment in sewer lines and certain other environments requires appropriate cleanup procedures. The transfer of biohazardous material or dangerous chemicals to operators and future conduit sections must be prevented.
Observer’s comments
The software setup process is consistent with CCTV preparation, which is a plus for operators who may be assigned AMP duty. The simplicity of deployment without a specialized vehicle reduces the cost of daily use. This could be offset by the challenges of inserting the pull cord from destination to origin manhole. This task requires human entry into both manholes and the associated safety protocols, atmospheric monitoring and all that entails.
Manufacturer’s comments
“The AMP’s value to an infrastructure owner is in the accuracy of the data and what that data tells those who use the data,” Carlin says. “The AMP provides decision-makers not only 3-D positional data but also offers insight into the condition of the pipeline structure. More accurate data allows proactive decisions that will help to break the cycle of reactive O&M.”
“We provide a two-day training program for a purchaser’s employees. An employee skill level must be such that it complements the AMP’s data-gathering capability,” added Monday.
Specifications as shown
The purchase cost of the demonstrated system is $55,000, which includes the AMP, laptop, and the supporting batteries, chargers and on-off keys.
The annual software maintenance agreement includes unlimited access to AMPVUE and software updates and entitles the end user to free annual calibration of the AMP. The basic cost for this agreement is $2,500. There is also a per foot charge of 55 cents for every foot of conduit processed through AMPVUE.
Wheel sets come in several sizes for different applications. Sizes range from 1.5 through 58 inches with prices from $4,800 to $11,800.