Order Digital Reprints
Filed Under
Sign Me Up!
Sign up Digital!
Subscribe to Print!
Akey to maintaining water distribution assets is knowing when to replace or rehabilitate aging pipes or address system reliability issues in other ways. Historically, such decisions have been based on rules of thumb, intuition and experience.
Now, a software tool from Bentley Systems gives managers a way to make decisions using data and quantifiable, reproducible best practices. The software tool produces rankings that help managers identify the pipes most likely to have an impact on system reliability and set priorities for repairs, system modifications or upgrades.
The software module can rank pipes based on criteria such as their year of installation, materials of construction, break history, hydraulic performance, fire flow capacity and criticality.
The information helps managers improve asset planning, increase distribution capacity, and maximize return on capital, while helping to decrease pipe breaks, leakage, lost revenues and outages.
The Pipe Renewal Planner module is included with the latest release of Bentley’s WaterGEMS distribution modeling tool and is an add-on for the latest version of the company’s WaterCAD distribution modeling and management application. Tom Walski, senior product manager with Bentley, demonstrated the application in an Internet meeting.
Walk-around
Pipe Renewal Planner is a Microsoft Windows-based module that assigns scores and rankings to individual pipes within a water distribution system. It analyzes data already entered into WaterGEMS.
Based on the user’s instructions, Pipe Renewal Planner automatically generates flexible, sortable tabular presentations showing pipe rankings based on specific conditions or combinations of criteria. It also creates color-coded distribution system maps that highlight pipe segments of potential concern.
Bentley recommends using the Pipe Renewal Planner module to integrate pipe scoring and ranking as part of the overall asset management process. Users can load the module with their preferred condition-related attributes and assign weights to each. The reports are generated mainly by using simple drop-down menus to select the pipe criteria against which to run the models and to choose the formats of the tabular and map displays.
Operation
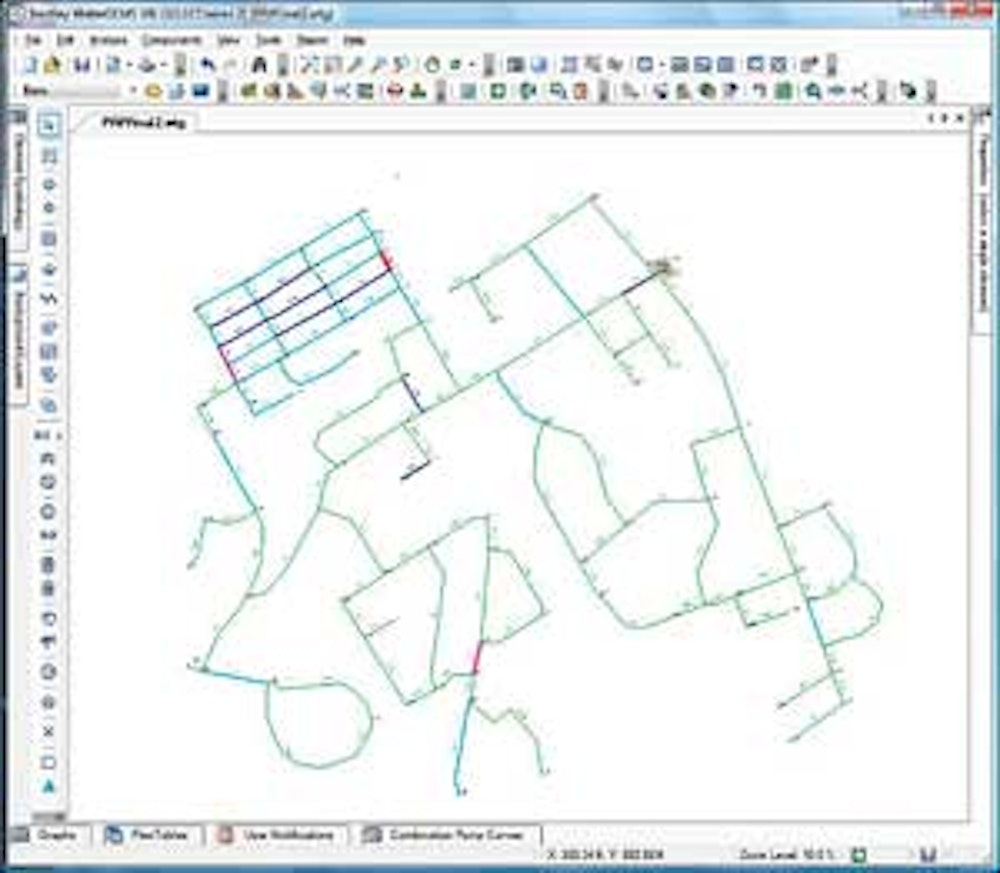
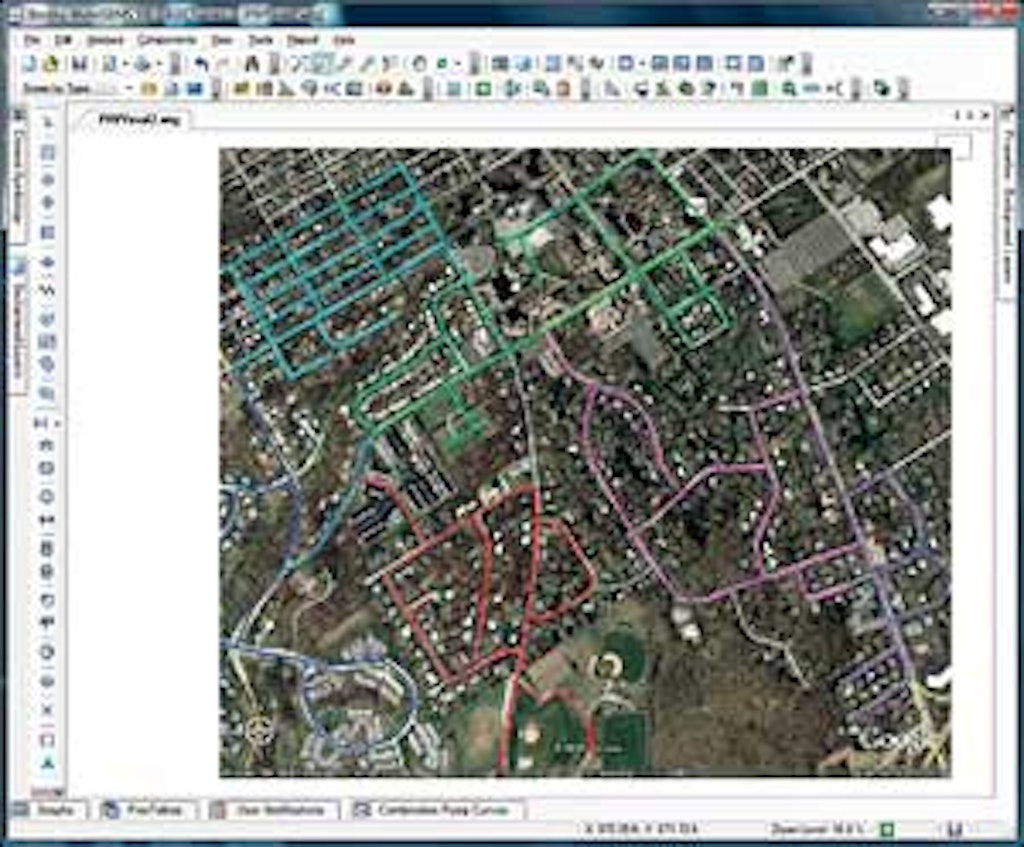
Walski opened WaterGEMS and the Pipe Renewal Planner module and displayed an aerial photograph of a small city with the water distribution system represented by colored “pipes” overlaid on the streets (Figure 1). The layout was of an actual city (not identified), but the water distribution system was fictitious and was designed for software demonstrations.
To make it easier to visualize the water system, Walski turned off the aerial photo layer so that the pipe network appeared in colors on a white background. He pointed out the locations of the water treatment plant, water tank and pump stations. Under his scenario, those facilities were built in the 1920s and 1930s. A green network of piping consisted of cast-iron pipes built in the same period.
Other sections of the system included an addition built hastily with asbestos cement pipe during World War II, a new water tank on a hill added in the late 1940s, another section built in the 1950s with ductile iron pipe, and the most recent addition built in the 1990s using PVC pipe. This scenario encompasses varied types of pipe at different ages and covers a range of reliability issues.
Walski then demonstrated the use of the software to display scores and rankings of pipe segments based on three separate reliability criteria — fire flow analysis, criticality and pipe break history.
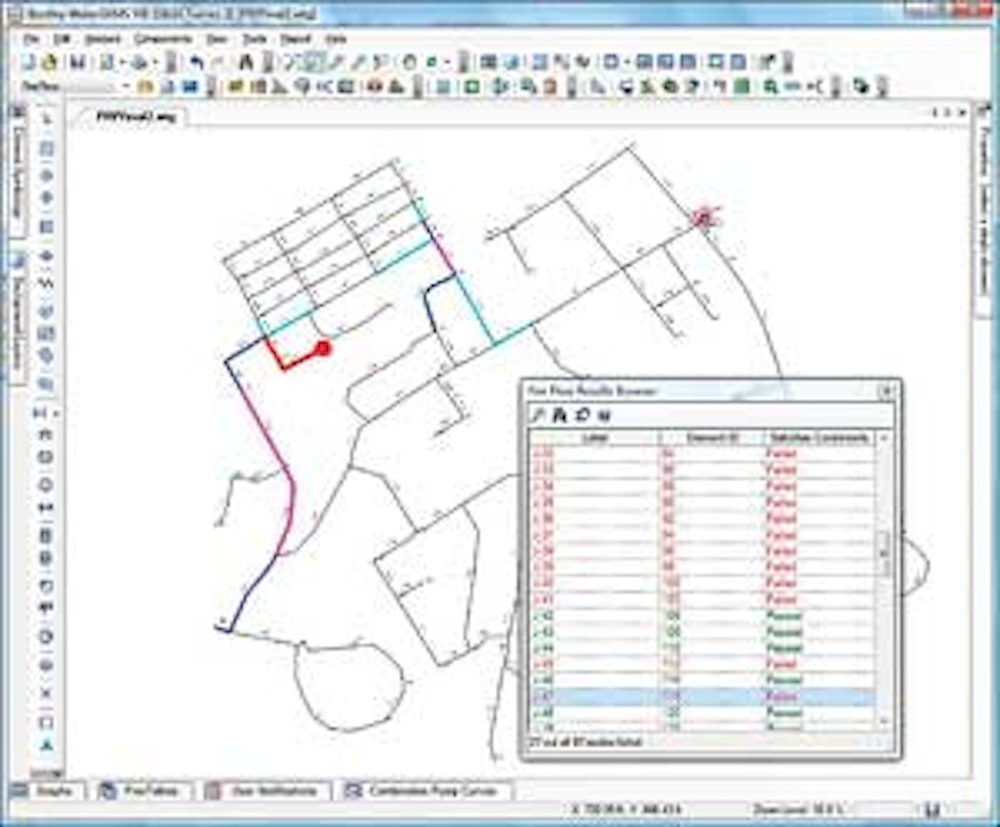
He began by using the menus to generate a view of fire flow analysis. The software automatically pulled data from WaterGEMS to generate a table listing pipes that did and did not meet the community’s fire flow criteria. He then created a corresponding map on which a red dot represented a fire hydrant location and red lines indicated pipes with limited fire flow (Figure 2).
The chart listed pipes as “passed” and “failed” according to the fire flow criteria; the pipe colors represented the flow velocity and indicated the locations of bottlenecks. The most problematic pipes appeared as red. (Walski noted that users can customize the color-coding to suit their preferences.)
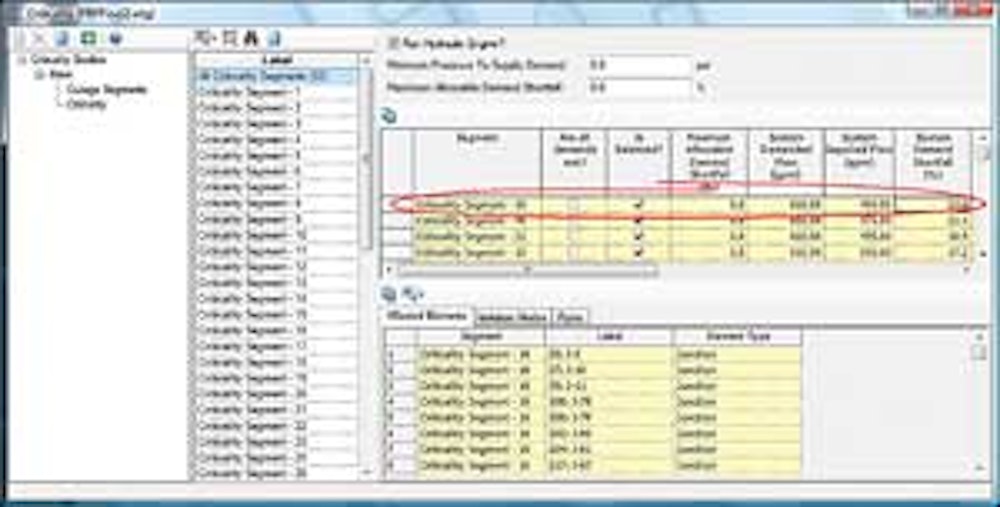
Walski then used the menus to rank pipes according to criticality — in essence how many homes would be without water or experience low pressure if a given pipe were to break or be taken out of service.
He first used the software to identify areas of the system capable of being isolated by valving and then ran the criticality analysis. The resulting table listed the most critical pipe segments ranked by the water shortfall that would result from their loss (Figure 3).
Next Walski performed a pipe break analysis, which depends on loading the WaterGEMS software with a pipe break history database. “Communities usually have pipe maintenance logs or software from which they can import that data,” Walski said. Break projections are based on each specific pipe’s history and on the histories of all pipes with similar characteristics.
He generated a table ranking pipes in descending order, starting with those having the highest rate of breaks per year per mile. A color-coded map showed the most break-prone pipe segments in red and magenta (Figure 4).
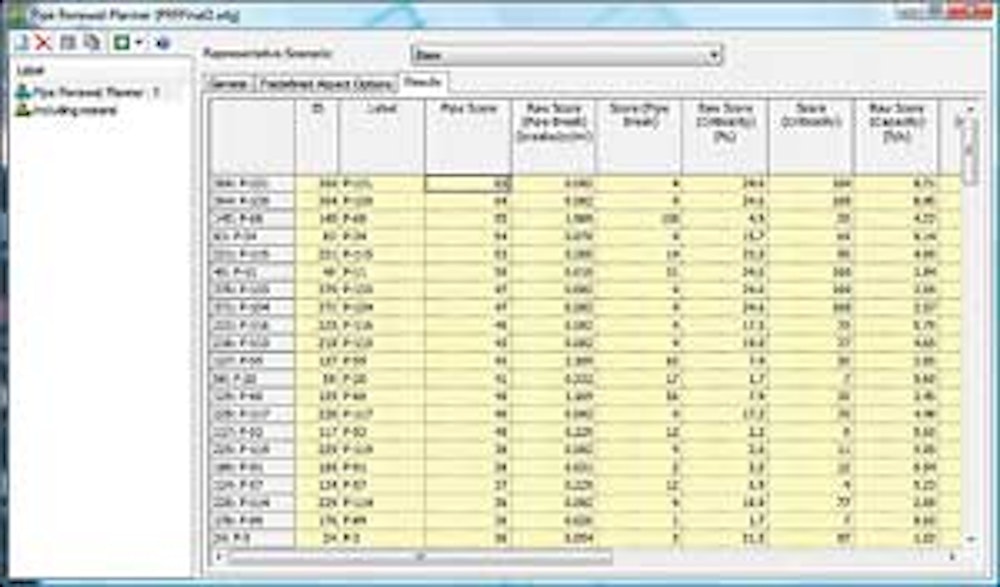
To create an overall assessment of pipe reliability, Walski then ran a ranking/scoring operation that combined fire flow, criticality, and break analysis, giving equal weight to each of those three variables. A tabular report listed pipes in descending order from those with the highest (poorest) scores (Figure 5).
Finally, Walski demonstrated how similar pipe scores, tables and color-coded system maps could be generated by adding more criteria, such as material, water-quality complaints (older cast-iron pipes may experience red water or other quality issues), and soil types (expansive clay soils or fault lines can contribute to pipe breakage).
Observer comments
Pipe Renewal Planner appeared easy to use in generating useful pipe scoring reports for assessing water system reliability, so long as the community has accurate data in its underlying software. Charts and color-coded maps enable users to see reliability issues at a glance that otherwise would be difficult to extract and analyze.
The pipe scores alone would not constitute a basis for making decisions on pipe repair or replacement or other system improvements but would provide objective data to use with experience and engineering judgment in planning a system maintenance and rehabilitation strategy.
Manufacturer comments
A high pipe score does not necessarily indicate a pipe that must be replaced, Walski observed. For example, a relatively new pipe, in good condition, might have a high score largely because it is highly critical. In that event, a utility might reconfigure the system to provide multiple feeds to the affected neighborhood and so make the pipe less critical.
“That’s the kind of judgment you have to bring to these analyses,” Walski said. “The software tells you which pipes have the highest scores, and then it’s up to utility management to decide what to do about it. The software doesn’t take the engineers’ judgment out of the picture.
“It’s a good management tool. Rather than just saying, ‘I think we ought to do this or that,’ you’ve got a quantitative way of looking at your system. Communities that make decisions strictly by pipe age, for example, get tricked sometimes. They may dig up an old pipe and find that it’s in excellent shape, and the next block over there’s a 10-year-old pipe that’s popping out of the ground.”
Walski noted that the WaterGEMS software, and by extension the Pipe Renewal Planner module, scales well to cities of all sizes. “It takes longer to build the distribution model for a mega-city, but these days much of the model building is done automatically from GIS files,” he said. “There isn’t much manual entry of data anymore. If you have a good-quality GIS, most of the data you need to build a model is in the GIS.”