Pipeline survey and reporting software is the critical link between pipe inspection cameras and actionable information. Software providers strive to make their applications versatile, flexible, easy to use, and compliant with standardized defect coding systems.
Pipeline Observation System Management (POSM) software is supplied and supported by camera manufacturer RS Technical Services Inc. The software (pronounced “possum”) is designed to support inspections of sanitary sewers and manholes, storm drains, water distribution pipelines, and other types of infrastructure.
POSM is certified under the Pipeline Assessment and Certifica-tion Program (PACP) Version 4.2, the latest database and testing standard from the National Associ-ation of Sewer Service Contractors (NASSCO). It is also certified under the NASSCO Manhole Assessment and Certification Program (MACP).
In addition, POSM is fully GIS compatible and certified by Neztek Systems Ltd. for database transfers in Hansen infrastructure management applications. On Dec. 5, Bob Katter, software engineer, gave an online demonstration of the product.
Walk-around
POSM software works with virtually any manufacturer’s CCTV cameras. The software gives users complete flexibility to customize databases. Users can tailor some 150 data fields and so support not only pipe and manhole inspections but wet-well inspections, valve testing, smoke testing, and many other functions.
Users can tailor the Header Page to include numerous fields or only a few, depending on the level of detail desired. “Some customers may want as few as five fields — what manholes, what date, what operator, and so forth — so they can quickly start recording an inspection without having to enter extensive data,” Katter says.
The POSM database can adapt to the users’ existing database and language. “The database controls what the software looks like,” says Katter. “Users can define any aspect and change the whole look of the program to suit their preferences.”
Colors and graphics simplify usage. On-screen buttons and labels are color-coded (for example, green typically signifies the button that starts an operation; red buttons stop operations). Pink database fields denote required information. Font sizes are maximized for readability.
Users can create their own observation codes, use standard PACP codes, or customize the PACP coding requirements using an Observation Code Editor function. For example, users can change the weightings of defect type and severity that are used to determine overall pipe condition scores. The software walks users through the coding process and will not allow improper data to be entered.
CD/DVD burning is fully integrated. POSM generates inspection reports as html files, which means staff members who receive disks with inspection data can view the files by way of a web browser without having to install the POSM software. Files can be viewed regardless of computer platform (Mac or PC).
The system supports inspection devices configured for laser joint and crack measurement, and for inclination profiling. It easily imports data from and exports data to geographic information systems (GIS).
Operation
Katter began the online demonstration by opening the main (Intro) screen. The upper left of this screen displays a list of older inspection sessions, any of which can be mouse-clicked to pull up reports.
Katter then clicked a green Start New Session button, revealing a Header Page with fields for entering pipe data. He selected the PACP database from a drop-down menu, then pointed out the pink-colored fields for required data and the pull-down menus for entering various pipe attributes. He demonstrated the customization of data fields using a Database Template Editor (Figure 4), then showed how fields can be quick-filled by linking to pipe data from a GIS.
He started the inspection session by clicking a Save Inspection button. At this point, if any header data were entered improperly, the system would highlight the error and direct the user to go back and enter the correct information.
At the start of the inspection a Main Observation Data Page appeared. (The startup automatically turns on an mpeg encoder if the data is being saved to a disk, or starts the VCR if the session is being taped.) The upper left of the screen displays the camera image along with whatever text information the user has chosen.
“Some users only want to display only minimal information, such as distance and defects,” says Katter. “Others list that plus project name, pipe data, manhole numbers, and complete observation codes. It’s all up to the user’s preferences.”
The observation screen includes a set of 10 “hot buttons” that help users locate observation codes from more than 190 in the PACP system. Katter showed how the buttons are assigned to frequently used codes or groups of codes to simplify the process of locating codes in the drop-down list.
For entering observations, Katter showed how users can click checkboxes to instruct the system to take a picture, mini-video clip or long video clip to accompany the report.
Among presentations of survey data in the software is a Plot Report — a graphical view of the pipe as if seen from directly above. Defects are listed in their proper locations and are color-coded according to severity. A click on any defect brings up the pictures and video clips recorded by the camera operator.
After finishing the session, Katter moved to a Session Manage-ment screen to demonstrate integrated CD/DVD burning. From a list of pipe inspection runs, he clicked to select specific runs to be burned. He then clicked a Record CD/DVD button, inserted a disk, and clicked Write Disk. Another feature lets the user print a jewel case cover that lists the inspections recorded on the disk.
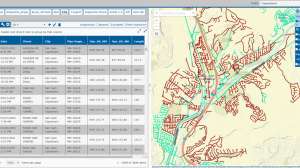
Finished reports include pages that show pictures of pipe defects along with descriptive data. Report data can be exported to a Microsoft Excel spreadsheet for sorting according to a variety of criteria. For example, pipes in a report can be sorted by PACP score so that technicians can easily identify those that have the most serious defects and need priority attention.
In the office, engineers and technicians can play back the recording or scan through the inspection at up to four times actual speed. An observer who notices a defect that the camera technician failed to mark can pause the video, add the observation, and add a picture or video clip to the report.
Observer comments
POSM software appears to offer high flexibility for recording the results of numerous types of infrastructure inspection. It gives users a wide range of options not only for gathering and configuring data but for accessing and viewing inspection reports.
The html report format facilitates the sharing of information among staff members. So does an RS Technical Services policy of granting unlimited software licenses for viewing and editing reports in the office. The company charges only for licenses used for data recording in the field.
The color-coded plot view of pipes, while not entirely unique in the industry, gives staff members an easy way to assess the condition of a pipe and to identify the most serious defects for quick examination.
While database and defect code customization options are extensive and would appear to require time and training to master, the tailoring functions demonstrated seemed simple and largely intuitive.
Manufacturer comments
Katter observes that POSM software has been on the market for seven years and has evolved based on the observations of customers in the field. “We spend a lot of time with customers, getting their input and watching how they use the program,” he says.
The program is typically sold in a hardware/software package with a three-year support program. This approach ensures that customers run the system on robust hardware that has been thoroughly tested and proven. “We provide high-end computer systems designed for in-the-field environments,” Katter says. “We now use laptop hard drives that take more shock than a standard desktop hard drive. Two of these drives are used in a RAID 1 mirroring configuration for greater data protection.”
The support package includes onsite replacement of major components such as hard drives, motherboard and video card. Customers have the option to send hardware to RS Technical Services offices in California or Kentucky for repair.
The company also offers online remote support, in which a technician can log onto the user’s system in the camera truck via an Internet connection, observe operations, answer questions, diagnose issues, check out hardware, and often make immediate fixes, such as template repairs and modifications. “It enables us in many cases to get customers back up and running in 30 minutes, rather than the day or two it takes to send a technician or ship computer components out and back,” Katter says.
Continue reading for free