Trying to meet wastewater conveyance and treatment needs without accurate flow monitoring is a little like trying to find your way in the dark without a flashlight.
The King County Wastewater Treatment Division (KCWTD), based in Seattle, Wash., is embarking on an extensive in-house flow monitoring project to help the utility see clearly into the future, but also:
• Identify infiltration and inflow issues.
• Monitor industrial discharges.
• Identify and plot salt water intrusion into the conveyance lines.
• Support specific pilot projects.
“The more you know about your system, the better off you are,” says Janice Johnson, wastewater engineer. The KCWTD is the largest wastewater utility in its state and acts as a wholesaler of collection and treatment services to 17 cities and 17 local sewerage utilities, known as component agencies. These include the cities of Seattle and Renton and the Muckleshoot Indian Tribe. Population served is more than 1.4 million, and the service area covers 420 square miles.
The utility maintains more than 350 miles of sewer pipe, 19 regulator stations, 42 pump stations, and 38 combined sewer overflow (CSO) outfalls. Two large wastewater processing facilities and two smaller plants treat about 200 mgd. A third regional plant, Brightwater, is under construction and scheduled for startup in 2011. The division also operates four CSO treatment facilities and one community septage system.
Need to know
In 2000-2002, the division imple-mented an infiltration and inflow (I&I) study as part of a mandated comprehensive plan. It hired an outside consultant to conduct flow monitoring to determine what was happening in its sewers, and to help plan for future conveyance and treatment needs.
Portable flow meters monitored more than 700 sites around the system for ten weeks each during the wet seasons of both years. The county got more than just data from the consultant’s work.
“The flow monitoring experience the county gained from the study really helped us to take a very close look at how we select and install flow meters, collect data, perform quality assessments, and interact with our internal and external clients,” says Abraham Araya, flow monitoring project manager. “After that first phase, the utility brought the project in-house, reduced the number of monitors in the system, and has continued the flow monitoring project to the present time.”
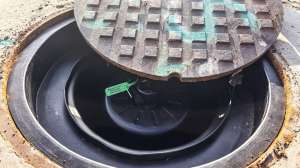
KCWTD has installed 106 portable flow meters (ADS Environmental Inc., Marsh-McBirney, and Telog Instruments) at critical points around the system — 42 monitors in the combined system and 64 in the separated system. A tandem of two-man field crews monitors flows. One covers the northern section of the county, the other the southern section.
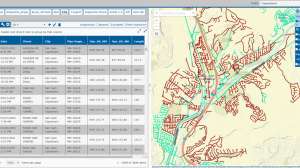
Forty-nine meters require crews to collect data manually by serially connecting to the flow meters. Fifty-seven other meters transmit data via telemetry to a computer system in the collection center. The data is later backed up to the main server at KCWTD for further data review and processing.
Fully documented
Field crews are required to document all field-related activities and observations and record them in site-visit and maintenance logs. “We have found out that the few additional minutes taken during field visits to fill out the logs save us hours of investigative work to determine what may have happened at a site,” says Araya.
“Another tool is the implementation of weekly meetings to discuss issues from the previous week, plan for the current week, and discuss any budget matters or procurement requests,” he says. Araya feels these one-hour meetings create a positive work environment where all staff members understand the importance of their work, communicate openly, and contribute to the success of the program.
It works. “Before the I&I flow monitoring study, there were some data issues, including the lack of proper QA/QC procedures, limited on-site data reviews, and lack of proper and detailed field verifications,” explains Araya. These issues often resulted in lower-quality data as well as data losses.
Now, with the system of regular data collection, maintenance issues are addressed immediately. “Our flexibility allows us to perform emergency troubleshooting and maintenance activities during data collection periods,” Araya says. “We perform field verifications regularly and on an as-needed basis, and also do on-site data review.”
As a result, data quality, reliability and availability have increased significantly.
That’s critical in King County, where growth and an increasing population have the utility carefully reviewing all future needs. Accurate flow data helps the utility verify its assumptions on capital projects, none more important than the new Brightwater plant.
Sophisticated membrane technology will be used there to deal with industrial discharges, and data from the flow monitoring program has been the basis for the design of the plant.
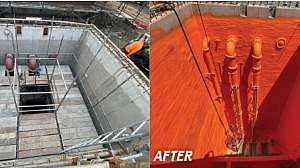
Another example is flow monitoring at 10 pilot projects in 2002-2003 and 2003-2004 to quantify I&I before and after various sewer rehabilitation techniques had been employed. In addition, the utility tracks salt water intrusion and the buildup and impact of hydrogen sulfide on conveyance lines. Conveyance system repair and future piping needs also depend on reliable data from the monitoring program.
As a service provider to its 34 component agencies, the division strives to respond to its customers’ needs, and here again, accurate flow monitoring plays a major role. “In terms of our clients, we have been able to deliver quality data, on time,” says Araya. “If someone wants to monitor a certain portion of our system for their project, we are able to sit down with the project manager and discuss the need for monitoring and propose alternatives that may help them refine their scope on a project.
“We are also able to perform site investigations, assess site conditions, install the appropriate type of meter and start collecting flow data within a matter of days.”
Lessons learned
In the nearly 10 years since the division initiated flow monitoring as part of its I&I study in 2000-2001, the utility has learned a number of critical lessons in how to make flow monitoring effective and economical. Among them:
• Devote adequate resources and staff to the flow monitoring project.
• Manage contractors and vendors for results.
• Use different flow meters for different applications.
• Develop standard operating procedures.
“Before the I&I study, we had one person maintaining as many as 90 to 100 sites, with help from another person for field work,” Araya says. “As a result, we were depending on a single routine for obtaining all the data, regardless of site conditions. There were no systematic field verifications, data reviews or analysis.”
The utility has since realized that effective flow monitoring requires adequate resources and has more than doubled its field staff to two, two-person crews, for a total of four people, who monitor 75-120 sites, plus an analyst to review the flow data. “This has allowed us to provide higher-quality data, better tailored to the needs of our end-users,” says Araya.
The utility’s experience and interaction with contractors and vendors have also provided useful guidance. Araya says utilities must insist on high performance deliverables from contractors, including high uptime and verifiable high quality data. Utilities also need to have trained staff working with contractors to perform QA/QC for data accuracy. QA/QC should be performed before the end of the monitoring period and the start of the modeling phase so that any questionable or problematic data can be checked out, Araya observes.
“Try to minimize the number of subtraction meters if possible,” he adds. “The level of confidence in flow measurements decreases with the number of subtraction meters required to calculate or quantify the net flow from a particular basin.”
When choosing vendors, customer service and technical support are paramount, and references are a must. “Some vendors may claim to have the best hardware or software for your monitoring needs,” explains Araya, “but it is useless if you are not able to use it because of the lack of proper and necessary support.”
Choosing meters carefully
The KCWTD recommends that vendors provide demonstration units so that the staff can collect as much information as possible before deciding which technology or com-bination of technologies to purchase.
“Look at things like ease of access to support, and how soon you get a response to your needs or concerns,” says Araya. “Are the technical support staff well-trained to address your concerns and help you troubleshoot equipment problems?” Finally, vendors should offer training to ensure that the staff knows how to operate the technology properly and efficiently.
In meter selection, it’s not a case of “one size fits all.” Araya believes utilities should perform careful site investigations and choose the metering technology best suited for specific conditions. “For example, a metering technology that works well at a site with relatively deep flows and reasonable velocities may not work at a site exhibiting shallow flows (less than 2 inches) and fast velocities (4 to 8 feet per second or more),” he says.
The division uses a variety of metering technologies, depending on site conditions. Araya notes that previously most of the flow meters used pressure sensors to measure depth of flow. But the pressure sensors were prone to drifting, resulting in data loss or poor depth data quality.
Since then, the utility has added meters that use ultrasonic sensors to measure depth, and uses metering technology with velocity sensors mounted above the crown of the pipe at sites that are prone to sensor fouling.
Araya says the division had no set standard or guidelines for flow monitoring before the recent projects. “Now, we maintain a set of standard procedures based on manufacturers’ suggested practices as well as our own experience,” he explains.
Standard operating procedures (SOPs) include step-by-step instructions on meter installation, initial and successive field verifications, data downloading, on-site data QA/QC, and troubleshooting. In the field, crews carry a CD or printout of the SOPs in their trucks.
“We have started working on summarizing some of the most commonly used tasks into field pocket guides,” says Araya. “We continually update these SOPs based on feedback from the field crew and any new information from meter manufacturers.”
The bottom line? Quality data demands adequate resources. “We needed to verify our monitoring sites more frequently and collect the data weekly,” Araya says. “This demanded that we commit well-trained staff dedicated to the flow monitoring program. You can’t do a quality job if you don’t have staff assigned specifically to that effort.”
Continue reading for free