Akey challenge in sanitary sewer flow monitoring has been turning flow information from multiple field devices in scattered locations into readily actionable data. The FlowWorks data management platform from FlowWorks Inc. addresses that challenge.
FlowWorks is a Web-based system that receives data from any major manufacturer’s flowmeters, rain gauges and other monitoring devices, adds information from SCADA systems, and pulls it all together in a single, secure environment where engineers can use tools to perform analyses and create and publish reports.
The system also collects data from U.S. Geological Survey (USGS) and National Oceanographic and Atmospheric Administration (NOAA) environmental stations. Users can graph, analyze and edit real-time data and easily perform advanced calculations. The information can be used for critical functions such as inflow and infiltration (I&I) analysis and creation of rainfall intensity, duration and frequency (IDF) curves.
The data helps support regulatory compliance as well as system condition assessment and system modeling for capital planning on new projects and system rehabilitation initiatives. The analyses and calculations save significant time for in-house engineering departments and consultants, says Timothy Hicks, company president.
Hicks demonstrated the FlowWorks offering via Web meeting, using a special demonstration model that draws data from actual in-the-field monitoring devices.
Hicks described FlowWorks as a massive SQL database. “All the data comes to our central database, fully secure, fully supervised, and backed up hourly, daily and weekly,” says Hicks. Customers can access their data — and only their own data — securely from any computer.
While SCADA information can feed the system, FlowWorks never “reaches into” the customer’s SCADA system, and so that environment remains secure, Hicks noted. Instead, FlowWorks sets up a system to which the customer transfers data files according to a predetermined schedule.
On top of the database is a computation engine that allows data from individual channels to be combined, monitored, alarmed and analyzed. Along with that customers have access to utilities that allow them to graph, analyze and report. Data — including manual data — comes into the system at intervals the customer chooses. “Typically, data is live on FlowWorks within three minutes of being received by our server,” Hicks says.
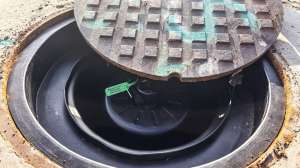
Data comes from stations — physical locations such as a lift station or rainfall station. Each station can have multiple inputs — channels — such as for flow, level and velocity in a sanitary sewer.
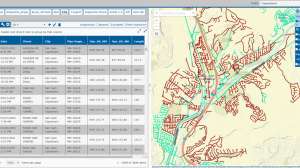
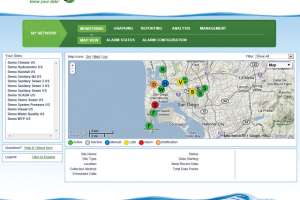
To begin the demonstration, Hicks opened the front screen to reveal a map, then used the mouse thumbwheel to expand the map and show the company’s demonstration site in the area of San Diego, Calif. Colored dots on the map represented live stations being used anonymously for demonstrations, with clients’ permission (Figure 1).
Each station was color-coded for its current status (green for properly functioning, yellow for late sending data, orange and red for alarm conditions, and blue for manual stations) and labeled with a letter for the type of station (for example, lift station or climate station).
A click on a sanitary sewer station brought up a box on the screen revealing that data was coming from a Teledyne Isco flowmeter, showing the most recent data sent, and listing the tools associated with the station. An expanded view also showed the station’s physical location (latitude and longitude), the data transmission interval (240 minutes), and the latest flow, level and velocity information.
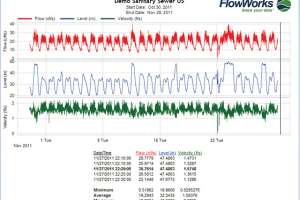
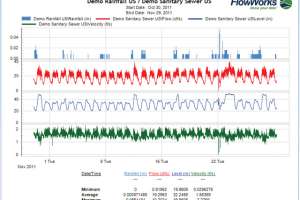
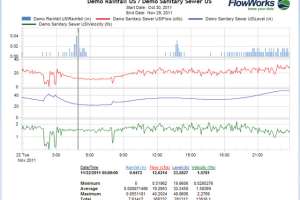
Hicks then clicked a Tools icon and created a graph showing the last 30 days of flow, level and velocity data (Figure 2). Next, he clicked to open a rainfall station and quickly generated a graph with rainfall plotted against flow, level and velocity (Figure 3).
Zeroing in on a rainfall peak that clearly influenced the flow, Hicks drew a zoom box around it and expanded that section of the graph. He then adjusted the graph to show 24 hours of data. As he moved the cursor over the graph, a “measuring stick” tool revealed the instantaneous flow, level and velocity for any point in time during that day (Figure 4).
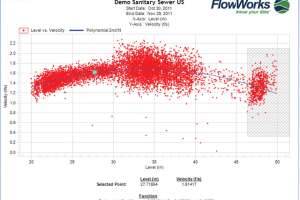
Next, Hicks demonstrated scatter plotting, pulling up a graph of all individual data points for the past 30 days, plotting flow velocity versus level. He then went to the Tools menu and performed a curve fit. “We can do linear curves, or polynomial, exponential, Manning’s equation, logarithmic, and others,” he said. “If we’re trying to prove data and figure out what’s going on down in the sewers, this is a very powerful tool.”
He pointed out a cluster of data points separated from the curve, representing “outlier” data points likely caused by an issue such as a rag stuck in the flowmeter (Figure 5). “The customer can set an alarm based on this data, so that if they start getting data points that far away from the curve, the system sends a text or email to a technician saying go and inspect the meter,” Hicks said.
Returning to the rainfall and flow/level/velocity graph, Hicks demonstrated how to use an editing tool to replace clearly inaccurate data. The ability to edit data is crucial to the ultimate accuracy of sewer system modeling, he noted.
“If you want to model off the data, but you had a bird build a nest in a rain gauge, you would want to replace the flawed data with sensible data so it doesn’t skew your model. With this tool, you can cut and replace the data with some data from another gauge that was working,” Hicks said.
Finally, Hicks demonstrated how to export a data graph into a Microsoft Word document as a high-resolution JPEG, or into a Microsoft Excel spreadsheet for analysis.
Hicks then turned to the calculation engine, used to perform advanced mathematical functions on real-time data. As an example, he showed how to use velocity and level information to calculate flow. “You can also use calculation to add channels together, such as by adding all upstream monitors to determine the total flow out of a basin,” he observed.
He then reviewed an alarm screen showing stations in alarm, with orange and red (most severe) to indicate the alarm level. Users can query each station to see what rule was violated to trigger the alarm and to view an alarm history. Hicks also demonstrated procedures for using an Alarm Configuration tab to set up alarms.
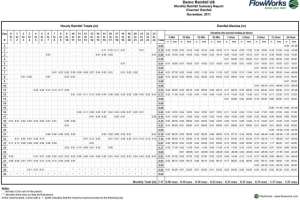
Next, Hicks demonstrated how the system makes use of rainfall statistics and analyzes rainfall data for sewer system operation and planning purposes. Data from rain gauges on the customer’s system comes into the FlowWorks database and automatically populates rainfall charts. “These are statistical tables of how much rain fell in which intervals, and that is a big deal if you’re doing modeling,” Hicks observed. “These charts are auto-generated in real time.”
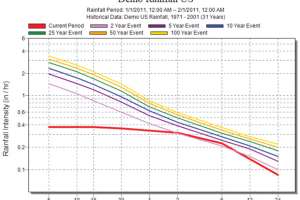
Hicks showed how users can link a rainfall station to FlowWorks and use the intensity, duration and frequency (IDF) tool to plot a storm event as it occurs, in seconds. The tool produces historic rainfall curves depicting 2-year, 5-year, 10-year, 25-year, 50-year and 100-year storms (color-coded) and also plots a curve (in red) showing the current storm event (Figure 6). The curves help users identify when an interval during a storm event is producing statistically significant rainfall.
“Many clients use this tool to ‘watch’ a storm event as it occurs from the comfort of their desk and send out their operations crews as a storm event hits a certain severity rating to areas where they know issues may occur,” Hicks said.
In conclusion, Hicks demonstrated an I&I Estimator tool. It produced a graph on which a blue tracing indicated the sewer system’s response from a rainfall event and a green tracing showed the dry-weather diurnal pattern. The system automatically subtracts the two to reveal the rainfall-dependent I&I (Figure 7). “This is the holy grail for municipal wastewater engineers,” Hicks said.
It was easy to see how the graphic, reporting and calculation capabilities in FlowWorks could save engineers from significant amounts of tedious work. The various reporting and calculation functions appeared to be intuitive, at least for an engineer or other professional experienced in sewer system operations and planning.
The system appeared to provide a “one-seat, one-screen” interface for reviewing the status of individual stations on an entire flow monitoring network and for making essential calculations to support planning decisions.
Hicks emphasized the engineering time savings the FlowWorks tools provide. For example, he stated that in calculating rainfall-dependent I&I, the tools “turn weeks of spreadsheet work into a couple of hours of FlowWorks work.”
He noted that FlowWorks is purely a data manager: “We do not sell any hardware, software or field equipment, and we do not do any engineering. We work with the customer’s equipment, engineering company and flow service provider to make sure they have what they need.
“Most customers already have the necessary equipment and only have to direct their data to FlowWorks. It doesn’t matter whose meters they have, and it doesn’t matter how they are receiving data. We work with their system to manage their data.”
He noted that the database accommodates photos, videos, text and Word documents, and assorted other information. There is no limit to the amount of data customers can store, and FlowWorks stores historic data at no additional charge for as long as a user remains a customer.
Continue reading for free