


The Western Municipal Water District is a complex entity that provides water on a wholesale and retail basis to customers in Riverside County, Calif.
With a diverse range of projects on its plate, the district has leveraged Esri’s small utility enterprise license agreement (ELA) to help bring geographic information system (GIS) mapping technology to a range of projects, including identification of new water sources, underground leak monitoring, leak reporting, preventive maintenance programs and customer fee calculation.
The district lies about 50 miles east of Los Angeles and serves about one million residential consumers through eight wholesale customers, including smaller water districts. It also directly serves 24,000 residential and retail customers, primarily in the communities of Riverside, Murrieta and Rainbow Canyon.
Water comes from a number of sources, including the Metropolitan Water District of Southern California via the Colorado River Aqueduct, Northern California via the California Aqueduct, and the San Bernardino basin. The district also operates several groundwater wells in its Murrieta Division.
Western is responsible for the engineering, infrastructure, management and strategic governance of the distribution system. Originally established to serve primarily agricultural interests, the district is responsible for transmission lines and pumping stations designed to reach its wholesale customers, but operates municipal sewer and water mains only for its 24,000 residential customers.
In July 2010, the district signed on to the Esri Small Utility ELA program, open to utilities with 100,000 or fewer meters or connections. Under the ELA, utilities receive unlimited access to Esri’s core ArcGIS platform, including ArcInfo, ArcEditor, ArcView, ArcGIS Extensions, ArcGIS for Server, ArcIMS, and ArcGIS Engine Runtime Deployments. The agreement also provides maintenance and support for products, staff training, and Esri data models.
“One thing that’s really important to me is that the ELA fits into our philosophy of being more efficient, conserving everything from water to our own department resources,” says Greg Duecker, the district’s director of information technology. “Having access to these GIS products across the district is making everyone more efficient, allowing us to access software that we might not have otherwise used and giving us the flexibility to have more users of more GIS products in multiple locations.”
The district had used some Esri software before activating the license but committed when the cost of the individual products crept up toward the price of an ELA.
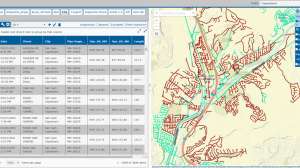
“Originally we would track infrastructure on a board with push pins, which were translations of handwritten reports,” says Patty Diaz, application specialist III with the district. “On our original AutoCAD maps, we weren’t always able to tell what was a pipeline and what wasn’t. We took all the reports and put them into spreadsheets. We also took several thousand drawings and imported them directly into our GIS database. We’re now all on the same page, and we can see all of the pipelines and anything else in our water system.”
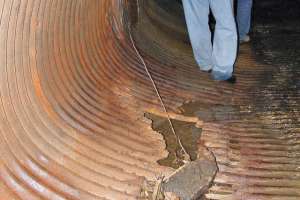
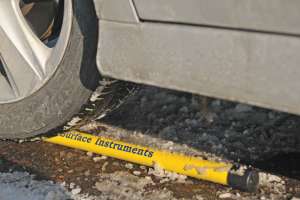
The GIS software suite has made a concrete difference in such projects as the 2320 Reach 1 Pipeline, also called the Hillside Pipeline project. The project involved replacement of 8,000 feet of 40-year-old 14-inch single-feed iron pipeline, which delivers water to the southern part of the district and serves about 5,500 customers. Hydraulically, the existing pipeline severely restricts movement of water into the south area, leading to operational inefficiencies at the Hillside Pump Station.
“It’s a section of very high-pressure pipeline that feeds a remote and sparsely populated area,” says Derek Kawaii, principal engineer with the Western district. “It is rugged terrain with slopes approaching 1:1 and a pipeline that goes through solid granite, so we needed to seriously consider the method we would use to replace this line.”
Considering the complexity of replacement, district engineers considered the possibility of a water supply interruption during construction. What was unclear was the number of customers who might be affected. Eyeball estimates based on traditional map data suggested very few would be inconvenienced.
“We used our GIS database and ran the software to determine what would happen if there would be a line break and which valves would need to be turned off to fix it if the problem lasted for a few days,” says Kawaii. “When we ran the data, we found out that the failure of that line would lead to a cascade of failures with other lines that feed off the pressure provided by that line and would have put 3,000 homes out of service. That led to a decision to put in a temporary line while we installed the new one.”
In preparation for the operation, Robert Conrad, application specialist III/GIS, used the GIS to pull the addresses of every homeowner in the pressure zone who might be affected by an outage. The district then sent notices to all of them, explaining that they might experience low pressure during the operation but would never be without water.
“This project is a case where the use of the software suite definitely modified both our planning and approach to construction,” says Kawaii.
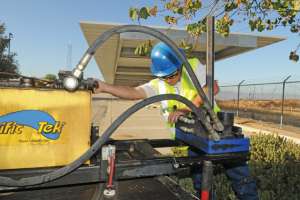
All new construction programs require contractors to provide GIS data for pipelines, valves, hydrants and other features. “When the contractor submits his redlines, our inspector goes through and verifies all of the nodes indicated,” says Sergio Felix, construction management supervisor. “When we deal with a leak or shutdown of any kind, that’s the data we rely on to protect our system and the surrounding property.”
GIS applications have also been used to develop a master schedule for wastewater system maintenance. “We inventoried every foot of the collections system, broke down everything that went into the collections system and treatment plants, and moved from a paper-based system to a computerized master schedule,” says deputy operations manager Stephen Schultz. “We’ve now got a two-year maintenance schedule that we can achieve by cleaning 19,000 feet of line a month.”
The department is looking to buy a CCTV system so that line maintenance operations can add the new video data to the GIS database. “Typically, CCTV should audit cleaning and maintenance, but the collection system is only 10 to 15 years old,” says Schultz. “And we don’t have a lot of restaurant or motel rows that typically cause blockages. However, CCTV will definitely be part of our future.”
Schultz likes the ability to customize maps using the current software suite. “We can use anything from satellite imagery to Google Maps and Google Street View as the background for our data, depending on what we need,” he says. His department is creating an emergency location map for all pumping and lift stations, creating GPS coordinates for emergency first responders.
The GIS is also being used in the district’s redistricting operation, an administrative requirement that follows publication of the U.S. Census. “We have five divisions within the boundaries of the district, each with its own director,” says Conrad. “However, some divisions grew faster than others. We’re required to use the census data to re-draw the boundaries so that each division has the same number of customers. GIS is helping us to do that.”
GIS software is even used to develop accurate billing for customers. “We can now take into consideration the geographic area where the customer and meter are located, the different pumping costs across the topography, the different water rate structures in different parts of a district, and the meter fee, and the application begins to generate a quote,” says Duecker. “It’s pretty elegant.”
The ELA also allows the district to upgrade to the latest versions of GIS software, increasing functionality on the fly. “By opening up the entire Esri catalog, we now have the ability to build a disaster recovery replication site, including replicating both the software and our GIS data, using licensing we didn’t previously have,” says Duecker. “That site could act as an emergency operations center during any major catastrophe.”
The district also uses the software as a jumping-off point to create even more specific software applications. Nobel Systems of San Bernardino, which is contracted to translate AutoCAD and mylars to GIS data, provided a special viewer for non-GIS staff to access GIS data more easily. It also developed a valve shut-off application that shows exactly which valves need to be closed under multiple scenarios.
The GIS department also develops its own applications, including specialty viewers that quickly access the desired GIS data for more experienced users. The department is working on developing preventive maintenance applications, asset management applications, and a computerized work management system. “A lot of our staff are hungry for more and better tools,” says Duecker. “They don’t want so much for us to show them what to do, but for us to help them to do things better.”
Continue reading for free