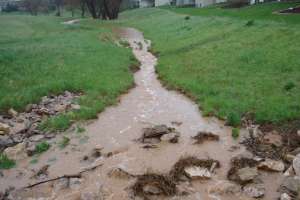
Nearly half of the U.S. population relies on groundwater as a drinking water source. That’s more than 140 million people, and about 45 million of that group draw groundwater through private wells — sources particularly vulnerable to contamination since they aren’t subjected to the same standards as public water utilities. Groundwater quality is important to the nation, to say the least.
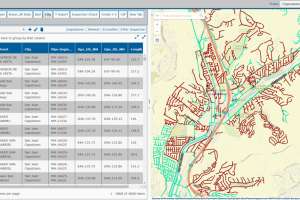
That’s where recently released data from the U.S. Geological Survey comes into the picture. As part of its ongoing National Water-Quality Assessment, the agency sampled 5,000 wells across the country between 1988 and 2001. About one-third of those wells were sampled again between 2002 and 2012 for various contaminants. The USGS then compiled data into an interactive map to depict trends for more than 20 contaminants.
The reasons behind any changes remain to be seen.
“We haven’t done the follow-up studies to answer that question,” Bruce Lindsey, a USGS hydrologist, told the website Circle of Blue. “We could speculate, but we aren’t in the business of speculating.”
He noted, however, that the map provides solid direction on what areas the USGS should study to better understand how management practices and other factors affect groundwater quality. The samples used came from 27 principal aquifers, and those aquifers account for more than 90 percent of the groundwater used in the public water supply. Here are 10 noteworthy trends that emerged from the data:
1. Arsenic levels are steady or falling
Arsenic can infiltrate water supplies through natural deposits in the earth, as well as agricultural and industrial practices. Based on the USGS study, the good news is there isn’t a significant upward trend in arsenic levels in the country’s groundwater. The only increase deemed large by the study occurred in monitoring wells near Albuquerque, New Mexico, tied to the Rio Grande aquifer system. Arsenic levels otherwise stayed stable or decreased. Samples from wells near San Jose, California, and Carson City, Nevada, showed the biggest declines.
2. Banned insecticide shows up in Pacific Northwest
Dieldrin, an insecticide developed in the 1940s and widely used into the early 1970s before being banned by most developed countries, showed statistically significant increases in monitoring wells connected to the Puget Sound aquifer system, near the U.S./Canada border and Vancouver, British Columbia. All other tested locations showed no change in levels of dieldrin. The contaminant doesn’t break down easily and biomagnifies, or increases in concentration, as it is passed along the food chain.
3. Chloride levels jump
Nationwide, the study showed an increase in chloride in groundwater. In the Circle of Blue article, Lindsey said road salt is a possible cause, and the most notable increases occurred in the Midwest and Northeast where road salt use is higher. However, large increases were also seen in the South.
4. Nitrate levels vary
Nitrate concentrations varied widely, according to the data. Although many areas saw little to no change to nitrate levels, other areas experienced a significant increase or decrease. The highest increases were in wells near Fresno, California; Stevens Point, Wisconsin; and Denver, Colorado. The largest decreases occurred near Columbia, South Carolina, and Salt Lake City, Utah.
5. Presence of commonly used herbicides remains stable
Several common herbicides were included in the map. For the most part, those levels remained unchanged with a few areas showing small increases or decreases. However, none of those changes were deemed large by the study’s criteria. The one exception was the Denver area, where monitoring wells tested in 2002 showed a large decrease in levels of atrazine compared to the first round of tests in 1994.
6. Total dissolved solids are up across the board
In addition to highlighting the presence of individual elements and compounds in groundwater, the USGS map looked at changes in TDS. Those levels have increased in the nation’s groundwater nearly across the board. The Southwest, Midwest, Northeast and Florida saw the most significant hikes. Only two areas in the country — northern Alabama and southern Georgia — showed decreases large enough to register as “statistically significant” by the study’s standards.
7. Gas additive holding steady
Gas additive methyl tert-butyl ether use has gradually declined in the U.S. in part because of its occurrence in groundwater, with ethanol becoming the preferred alternative. The USGS study backs that up. For most of the country, levels of methyl tert-butyl ether have remained stable or decreased slightly over the past two decades. The exceptions were wells near New Orleans and Philadelphia, which showed small increases.
8. Iron and manganese levels drop
Although not detrimental to human health, iron and manganese can cause discoloration and taste issues with drinking water, as well as treatment problems for utilities. It’s gradually becoming less of problem, however, according to the USGS study. Concentrations of those two naturally occurring elements showed no change or a downward trend across most of the country.
9. Uranium up in California, New Mexico
Uranium levels have stayed largely unchanged, with a few exceptions. The increase was greatest in wells near Las Cruces, New Mexico, drawing from the Rio Grande aquifer, and wells south of Sacramento, California, drawing from the Central Valley aquifer. A 2015 study by researchers at the University of Nebraska linked high levels of uranium in groundwater with high levels of nitrate runoff from factory farming, describing how nitrates can increase uranium’s solubility in water. The Central Valley aquifer was a focus in that study, and the USGS data appears to support the study’s conclusion. In addition to increased levels of uranium, networks of wells connected to the Central Valley aquifer also showed an increase in nitrate levels.
10. Dry-cleaning fluid levels down
Levels of tetrachloroethylene, a colorless liquid used in the dry-cleaning industry, showed no changes for the most part, but two areas dropped significantly. A network of wells near Carson City, Nevada, showed a decrease between sample testing in 1995 and 2002. A network of wells near Salt Lake City, Utah, also showed a decrease between testing in 1999 and 2012.
Continue reading for free