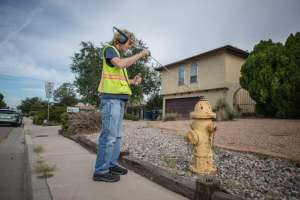
A recent survey by J.D. Power is giving water customers a voice on their level of satisfaction with local utilities. The recently published report on the survey indicates that 30 percent of consumers have problems with their water quality, which is a rate far higher than what has typically been reported in the EPA’s Consumer Confidence Reports.
J.D. Power claims its findings exposed limitations in the federal reports. “While the mandated water quality reports produced by regional water authorities do a great job of measuring specific water quality issues, they are not telling the whole story when it comes to perceptions of the water that is coming out of customers’ faucets,” says Andrew Heath, senior director of the utility practice at J.D. Power.
After the report was published, news organizations in various cities around the country were quick to pick up the story of where their own utilities ranked. According to the J.D. Power survey, Louisville (Kentucky) Water ranked highest in customer satisfaction in a tie with St. Paul (Minnesota) Regional Water Services for the Midwest. Meanwhile, the Cleveland (Ohio) Division of Water ranked last in the Midwest region.
In a statement, the Cleveland Division of Water wrote that its customer service satisfaction index score in the report increased by 23 points from 2017 to 2018. “This increase is a reflection of the ongoing improvements we have made. We are in the process of reviewing these findings in more detail. We recognize that there is still work that needs to be done, and we are continuing to invest in technology, training and our employees to ensure we are delivering best in class customer service.”
Kelley Dearing Smith of Louisville Water Company told Insider Louisville that in all three years the survey has been published, the Kentucky utility has fared well. “But this year, we were just thrilled to see that we got the highest ranking tied with St. Paul,” she said. “When you talk about quality, I think taste is probably the most important aspect. The water could be totally safe to drink, but if it doesn’t taste good, people aren’t going to want to drink it. So, we put a lot of effort into making our water taste good.”
Following are some of the key findings of the 2018 study:
- Among the 30 percent of residential water utility customers who mention a quality problem, 12 percent cite low pressure; 11 percent cite bad taste; 8 percent cite scaling/water hardness; 8 percent cite discoloration; 6 percent cite bad smell; and 4 percent cite high lead/mineral content.
- Significant differences across the nation are found from the best water utilities having less than 20 percent of their customers indicating a problem with water quality to many utilities having more than 40 percent of their customers citing a water-quality problem. One utility has more than half of its customers reporting a water-quality problem.
- Customers who experience water-quality problems have significantly lower delivery satisfaction scores than those who experience no problems. Bad taste and scaling/water hardness are associated with 143-point declines (on a 1,000-point scale) in delivery satisfaction scores, while scaling/water hardness and bad smell are both associated with a 152-point decline.
- One of the most negative effects on satisfaction is a service interruption caused by pipeline work. Satisfaction scores are 42 points lower among those experiencing pipeline work-related service interruptions than those among customers who experience no interruptions. However, when customers have previously been made aware of water utility system upgrades, satisfaction scores are 58 points higher among those who experience no service interruptions.
- Customers who recall receiving four to five communications from their water utility have communications satisfaction scores that are 148 points higher than among those who do not recall receiving any direct communications.
- Billing and payment satisfaction among customers who receive their bill electronically is much higher than among those who receive a paper bill.
For more information, consumers concerned about water quality are encouraged to review the Consumer Confidence Report provided by their water utility at www.epa.gov/ccr.
J.D. Power’s Water Utility Residential Customer Satisfaction Study, now in its third year, measures satisfaction among residential customers of 88 water utilities, delivering water to a population of at least 400,000 people and is reported in four geographic regions: the Midwest, Northeast, South and West. Overall satisfaction is measured by examining 33 attributes within six factors (listed in order of importance): delivery, price, conservation, billing and payment, communications, and customer service.
Continue reading for free