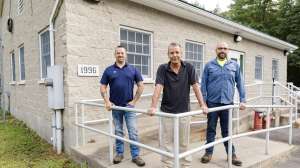
At Padre Dam Municipal Water District in California, wastewater collections supervisor Rich Schultz and GIS coordinator Jen Gordon have been working together on a program that utilizes technology to maximize efficiencies while maintaining reliable wastewater services in East San Diego County.
With roughly 170 miles of sewer mains, over 15,500 total wastewater connections and a population of over 70,000 people, the two have a lot of ground to cover. Looking to improve their sewer inspection and reporting workflow, the District deployed WinCan VX in 2018.
WinCan developers collaborated with Schultz and Gordon to design a specialized sewer main cleaning/flushing application, which the team at Padre Dam implemented in April 2021. The application makes communication and remote collaboration easier for teams working in different areas of the same region.
Finding a unique inspection solution
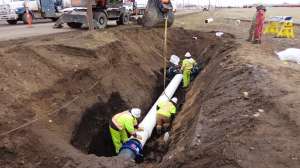
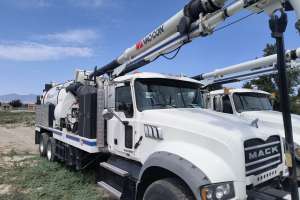
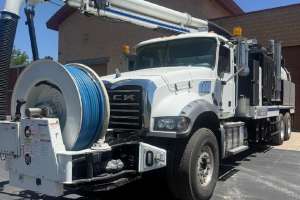
Throughout the year, Padre Dam cleans/flushes up to 600,000 linear feet of pipeline, with a full system clean/flush every 14-16 months. With two Vactor trucks, two operators and two utility workers, the team cleans and addresses challenges and issues in the system. Relying on traditional pen and paper reporting methods, valuable time was once spent organizing, deciphering and verifying records — leading the municipality to look for a more efficient solution.
Schultz and Gordon worked with WinCan to find a customized solution for digital reporting via a flushing application that syncs back to the District’s GIS. But more than that, Schultz says the program assists operators in remote collaboration while out in the field.
“When the two operators are cleaning the same section, they won’t have to call each other,” Schultz says. “Data will auto-populate up-to-the-minute — helping to ensure they’re not over-flushing the area. It’s going to help minimize potential human errors, opposing numbers, and incorrect upstream/downstream manhole numbers.”
Schultz, whose job it is to make sure operations run smoothly, expects the adoption of digital reporting to streamline the flushing process, helping crews to get the job done with fewer concerns about accuracy.
Creating better deliverables
With the diverse landscapes in Padre Dam’s service area, Schultz and Gordon are used to conducting unique projects that call for an added layer of innovation and data analysis.
“Because we have the data in a nice, easily accessible, cleaned-up database, we’ve been able to share that data with some of our engineers who are working on projects for identifying leak areas, or pollution control and other possible reporting requirements,” Gordon says.
WinCan has also helped them build on their usage of NASSCO codes.
“When they’re looking at reports, some engineers like to have standardized codes and ratings that they’re going by,” Schultz says. “WinCan offers all of that in a way that’s easily digestible for team members who might not be NASSCO-trained.”
And while standardized data is valuable, visualization of that data provides insights that numbers can’t.
Bringing data visualization to the forefront
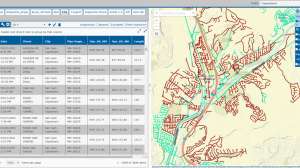
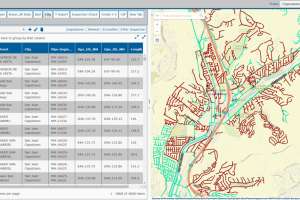
Because the Padre Dam service area spans multiple communities, being able to visualize infrastructure data is crucial. Using WinCan’s integration with Esri’s ArcGIS has drastically improved the inspection and flushing workflow for Schultz and his team.
“Staff in the field appreciate that they can color-code the different sections,” Schultz says. “They open ArcMap and they code it with sections from a given work order that have already been CCTV’d, sections that still need to be done, and any section that hasn’t been inspected in two years.”
This has made priorities easier to visualize and helped them gain efficiencies, he says.
WinCan’s dynamic pipe graph has also made a difference to the team’s speed and efficiency in reviewing inspection footage.
“I used to have to watch an entire video and then try to stop it right on the defect,” Schultz says. “Now, we have the ability to jump right to the location or lateral in question, simply by clicking on the pipe graph.”
To learn more about WinCan VX, request a free demo today: