Richard Radcliff loves his numbers.
“As a civil engineer, I’m all about measurement,” says Radcliff, combined sewer overflow operations manager for the South Bend (Indiana) Wastewater Department.
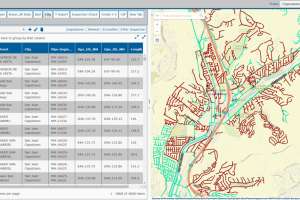
The numbers generated by a network of sensors (CSONet, hosted by Xylem Vue) on the collection system, along with data visualization tools developed by South Bend and EmNet, enable Radcliff to see trends and spot issues before they become problems. As a result, dry-weather overflows of the combined sewer system have all but been eliminated, and wet-weather overflows substantially reduced.
“Our overflows per inch of rain keep going down and down,” Radcliff says. Part of that reduction is from a sewer separation project, and other efforts to prevent I&I, but Radcliff thinks much of it comes his team’s use of data collected by the sensors to manage the system better.
Multiple sensors
Originally installed in 2007 and upgraded in 2017, the 150 sensors in the system measure flow, depth, velocity, positions of weirs and gate control valves, water temperature, river level, turbidity and oxidation reduction potential (ORP). The system has automated valves to direct the flow in the sewers and control stormwater basin levels.
“We’ve learned quite a bit from having the sensor data,” Radcliff says. “For example, we discovered our interceptor pipe was not being completely filled before we would have wet-weather discharges. Using the sensor data, we identified places in the system where we could run parallel throttle lines and pinch valves.
“It’s a ‘smart’ sewer system. As rain comes in, the pinch valves open up and allow more flow to go into the interceptor, until all that capacity gets filled. Then they start closing down. We’ve been able to optimize flow into the interceptor and help minimize wet weather discharges.”
Data for planning
Radcliff hopes the sensor data will help improve the design and reduce the cost of the next phase of South Bend’s long-term control plan. The first phase was the creation of the sensor system, along with separation of the storm and sanitary sewers in some neighborhoods. The first phase reduced combined sewer overflows by 75%, according to the city’s website.
The next phase will involve building storage areas in the collection system. The original estimated cost was $700 million, more than four times the cost of the first phase, but data collection over the years has led to some modifications. The new Phase 2 is called the Smarter Alternative for a Greener Environment and has a much lower price tag at $200 million. The city is waiting for federal approval of the new plan.
“We recognized that we could do this a lot better,” Radcliff says. “It’s like the old expression, ‘You don’t know what you don’t know.’ We got smarter over the life of the sensors that we put in. That’s what allowed us to revise our long-term control plan and, we hope, save the city a considerable amount of money while concurrently making the environment better.”
Revised storage
Radcliff says the revised plan still calls for underground storage, but not as much as in the initial plan. “We’re still going to need tanks; the system still does overflow, but the sizes and the locations have changed,” Radcliff says.
“The success we’ve had will allow us to build smaller and fewer tanks than we thought we would need. Sensors brought light to the collection system and allowed us to find blockages, find I&I and find problems. Sensors gave us a better focus on where the problems are.”
Working with the numbers and visualizations that the sensor network produces, Radcliff can see problems developing that sometimes don’t show up in a physical inspection. In one incident he called to alert a crew on the road to a problem at a site. They said they had just checked it, and it was OK. Radcliff didn’t think so and arranged to meet them at the site.
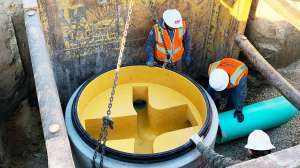
“This place is 25 feet deep,” he says. “We set up confined-space equipment and sent a man down there. When we brought him back up, he had a quarter-piece of manhole cover that had lodged in there. It wasn’t enough to stop the flow, but over time, stuff could have built up on that piece of manhole cover and caused a blockage, and possibly an illegal overflow.”

Discovering “monsters”
His colleagues wondered how he knew what was in there; he said he didn’t know what it was; only that something wasn’t right. “I’m in an office two miles away, and this is 25 feet underground,” Radcliff says. “I saw the level rise a tenth of a foot, and I knew that wasn’t normal. This is the kind of thing you miss with your eyes, but the numbers don’t lie.”
A quarter of a manhole cover is tiny compared to some of the things Radcliff and his crew have found in the collection system. At one point he saw a bump in the trend line for a section where the water level went from 2 to 3 feet to 4 feet, then back to around 3 feet. They found a large amount of grit in the section where the water level bumped up. After a CCTV inspection, they found a root mass that was slowing down the flow and causing the grit to be deposited.
They also found large chunks of concrete and rocks that formed a dam inside the 96-inch interceptor sewer. The only way to remove that was to send a diver in to tie ropes around the obstructions so they could be hauled out. “To me, looking at numbers, I know what normal looks like,” Radcliff says. “It could be a manhole cover, a root mass, whatever. It’s apparent to me from a distance.”
Radcliff has given a PowerPoint presentation called “Discovering Sewer Monsters” at an Indiana Water Environment Association conference and other events. One obstruction found in the sewers he named “The Blob,” because it resembled the monster from an old sci-fi film. Another he called “Jaws” because it reminded him of a shark. He adds theme music to the presentation to enhance the effect.
Targeting maintenance
The sensor data also helps South Bend prioritize maintenance near the 35 overflow points in the system. “It may not be necessary to go to every site every single day,” Radcliff says. “If any sites appear to be above normal ranges, we can go to those sites. It allows me to optimize flow in the system and optimize maintenance and operations.”
Over time, sensors have shown that some areas are problem-free, so the sensors could be moved to places where they might be more useful. “As a result of looking at the data, it’s clear that some sites we don’t need to worry about,” Radcliff says. “We’ve moved sensors around, we’ve deleted some in some areas, and we’ve added some to others. It’s a living, ongoing system.”
Before the monitoring system was installed, South Bend was averaging 35 dry-weather overflows a year, each one resulting in a hefty fine from the EPA. Now the system almost never has dry-weather overflows. Radcliff can’t imagine managing a sewer collection system without a network of sensors.
“If someone asked me to manage a system that didn’t have sensors, I’d say it’s all but impossible. I don’t know how you could manage a collection system without a sensor network. You’d just be blind. You’d never be able to quantify the effect of the changes you make.”
Continue reading for free