Newport News lies at the end of the Virginia Peninsula, bounded by the James River, York River, and Chesapeake Bay.
But it’s the water that flows into the city that concerns Steve Land, administrator of the Department of Public Works Wastewater Division. Most stormwater runoff is conveyed in open channels, and drainage from other up-peninsula cities moves through Newport News on its way to the bay.
“In a large event, we’ve got water flowing to us from several sources,” notes Land. “It even crosses I-64, the backbone of the peninsula. So we need to coordinate our efforts with other cities, as well as the Virginia DOT.” The impact of hurricanes Floyd (1999) and Isabel (2003) supplied more incentive to improve infrastructure, organization, and response. The majority of Newport News lies less than 80 feet above sea level.
To Land, the solution was obvious. His division was still using printed maps, had no computer database of assets, and was sharing its limited resources between sanitary and stormwater. GIS mapping was the logical first move.
The city has mapped its sanitary sewer system and is starting the long process of mapping stormwater assets as well. Among the benefits, a thorough inventory will help the city build a stormwater system maintenance program and cost-justify the equipment and staff resources that requires.
Preliminary work
The Wastewater Division split its original combined wastewater system in the 1970s, using mostly federal funds. The city created separate divisions for sanitary sewers and stormwater in 2005. Before that, the Wastewater Division handled all water work. “We had about 140 people working in our division,” Land explains. “I decided it was time to reorganize and sharpen our focus.”
Land started with the Waste-water Division in the 1990s, after a tour with the U.S. Army Corps of Engineers. Combat engineering honed his leadership and problem- solving skills, providing valuable tools for his current position. The need for an accurate database of system infrastructure was clear.
“GIS is a very powerful tool, but we needed to find a contractor with a good reputation and solid data skills, someone who could work tightly with our municipal crews and ensure the level of quality and detail we wanted,” Land recalls. That contractor was GeoDecisions, a subsidiary of Gannett Fleming Inc., based in Camp Hill, Pa.
GeoDecisions’ initial work focused on the sanitary sewer system. GeoDecisions personnel gathered and input field data and also located and inspected some 8,000 manholes with 0.15-foot accuracy. They logged standard features and attributes for all major assets in the sanitary sewer system.
As the database grew, the division began adding stormwater infrastructure to the model. The first step was to divide the storm-water system into defined drainage areas, enabling computerized maintenance scheduling. Now, nearly eight years into the project, the sanitary system is completely mapped (except for laterals, which will be added later), and the focus is shifting to stormwater mapping.
Stormwater mapping is more complex because of the variety of assets included. In addition to pipes and pumping stations, the model includes everything from ditches to lakes. “If it impacts drainage, we’ll need it in the system,” Land says. He expects stormwater mapping to be complete by 2010-2012, provided funding continues.
Birth of a division
DPW’s Stormwater Operations Division is the new kid on the block. “We didn’t exist before 2005, even though many of our operations were already being done by the Wastewater Division,” says Eddie Crockett, division administrator. “So all we had to start with was a bunch of printed maps.” Crockett took over where Land left off, inheriting Waste-water’s still-growing digital mapping program.
“As we go through the mapping process, we find a lot of things we didn’t know were out there,” Crockett says. “We’re also discovering errors in recorded pipe sizes and locations, some off by as much as 10 feet. It’s like an inventory process right now, so we’re just really learning the details of what we’ll need to manage.”
Just finding some of the assets has been a challenge. Over the years, private and commercial encroachments into the right-of-way have buried assets under concrete, asphalt, plants, fences, swing sets, and other structures. “Whenever that happens,” says Crockett, “we let them know they’re out of compliance. We tell them what they need to do, and we give them a reasonable amount of time to fix it. We’ll work with them on this since it’s to everybody’s advantage to get it right.”
In their spare time
The GIS mapping project keeps the team busy, even with GeoDecisions handling all the field data acquisition. If an asset can’t be located, Crockett’s team has to pull out the maps and help find it. Plus, they have an existing stormwater system to maintain.
With some 180 miles of open channel conveying the bulk of stormwater runoff, regular maintenance routines are essential. The larger channels, up to 60 feet wide and 20 feet deep, comprise about a third of the system. Many of the channels transport runoff from other cities farther up the peninsula. Newport News, located at the end of the peninsula, sometimes must deal with other peoples’ problems.
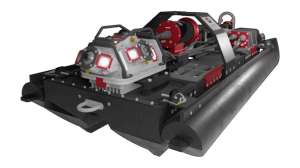
The stormwater division has two 1,500-gallon-capacity Vactor combination units and a single CCTV truck, but can borrow additional equipment from Wastewater as needed. When a division is only two years old, lack of internal resources can be a burden. “We need to finish our system inventory first,” explains Crockett. “Then we can justify the cost of adding maintenance resources.
“We don’t even know what we have yet, so we can’t plan a regular maintenance schedule. We can be reactive, but not proactive. Once we know what we’ve got, we can be a lot more effective.”
The stormwater division focuses routine maintenance on areas known for problems with debris accumulation and overflow. “But,” notes Crockett, “as things stand, when a large storm hits, pretty much everybody in DPW switches over to stormwater support activities. We need to get beyond that, and digital mapping is our ticket.”
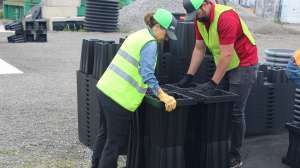
Support from the private sector helps. A public education program, HR (Hampton Roads) Storm, disseminates useful information about disposal of waste, use of fertilizers and pesticides, and other practices that affect water quality. Compliance is good. Volunteers from Scout troops and other community organizations often help with cleanup programs along the James River and Chesapeake Bay.
Digital details
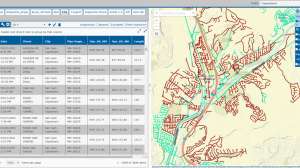
The Wastewater Division GIS mapping system is the brainchild of GeoDecisions. Their proprietary software, G2SmartMapping 4.0, was developed specifically for field data acquisition of features and attributes in sanitary and stormwater conveyance systems. It includes GPS location and mapping and integrates seamlessly with ESRI ArcGIS software, providing flexible display options and data transfer. But that’s not all it does.
Mohamed Kacem, senior project manager at GeoDecisions, explains, “The software has nine quality-control measures built in. Things like field checks of auto-populated data, attribute transfer validation, and topology rules checking ensure the database is self-consistent.” In simple terms, it allows assembly of an accurate hydraulic model that can be used for system simulation, proactive maintenance, and planning for upgrades and expansion.
G2 acts like a “quality control filter” between field data acquisition and the GIS that displays the data. The user interface provides map overlays of everything from pipes to ZIP codes to ocean storm surge contours and is available to all municipal agencies. G2 has provided essential support in areas as diverse as emergency response, crime analysis, and fire rescue.
Building the model
With only a fraction of the stormwater infrastructure mapped, there’s time to fine-tune the process. Components are being added on a priority basis — the most troublesome items are first to be logged. Deciding which features and attributes to record is important, and getting it right the first time means not having to go back and do it again.
Stephen Williams of the Depart-ment of Engineering recalls, “When we first starting logging system assets, we didn’t look far enough ahead. As our management concepts evolved, we found we needed additional attributes, so now we need to go back and get that data.”
One crucial part of the model is soil, which includes a mixed bag of sand, loam, clay, and rock. The water table is high and can create “running sand,” a geological stratum that flows like horizontal quicksand. If a basin or ditch is part of the system, underlying soil attributes must be recorded.
In addition to the physical locating components of the system, the topological connectivity of G2 allows hydraulic modeling of system perturbations, such as storm surges, precipitation, and new development. To enable this level of modeling, the system must be calibrated by monitoring actual effects of both natural and induced events.
Extracting value
The Wastewater Division was the first to see major benefits. Williams notes, “During the mapping process, we found assets we didn’t know we had. That had a huge impact on our quality assurance level. You can’t manage what you don’t know.”
Stormwater ultimately ends up in Chesapeake Bay, a major resource for commerce and recreation. Beach closings are frequent along the bay, signaling problems that need attention. “Chesapeake Bay is all about a way of life,” notes Crockett, “and GIS modeling will go a long way toward helping us ensure that continues.”
Newport News was the first city in Virginia certified by the American Public Works Associ-ation (APWA). The certification recognizes commitment to high standards of performance, progress in emergency planning, and cross-agency collaboration. Procedures are in place for natural events up to a Category 3 hurricane, roughly equivalent to a 500-year “regular” storm event. This level of event would put the city into what Crockett calls “recovery mode,” but such plans are essential for public safety.
Future payoff
The total cost for system mapping (sanitary plus stormwater) is expected to be between $2 million and $3 million, but it will be money well spent, says Crockett. “We should have done this years ago, but sometimes it’s tough to convince people to spend that kind of money,” he says. “Ultimately, having this data allows us to move from being reactive to proactive.
“Currently, when we want to locate something, we need to pull out a full set of drawings, and you can imagine how labor intensive that is. Once we get this stuff into a digital layer, we can go to a computer, pull it up, highlight an area, and see exactly what assets we’ve got. It gives us new capabilities once we’ve got this stuff on a computer.”
When the entire system is mapped, tasks like maintenance scheduling, emergency response, and planning for expansion become far easier. Simply knowing the pipe sizes, what they are made of, and whether they are round or elliptical makes the routine task of stocking parts less a matter of guesswork.
“Having an accurate inventory of assets also allows us to justify requests for more personnel and equipment to maintain what we have,” Crockett continues. “Bottom line is, GIS modeling takes us to a whole new level of doing the job we’re hired for.”
Continue reading for free