Extreme climate and weather events are occurring more frequently with more intensity. Central to these events are the impacts to water — from drought to floods and much in between. In order to better plan for the future, several of the largest water agencies and organizations, including the Water Environment & Reuse Foundation, collaborated with the National Oceanic and Atmospheric Administration (NOAA) to create a water resources dashboard.
The Water Resource Dashboard is housed on the national Climate Resiliency Toolkit and provides information on weather forecasts, hazard alerts, watershed and stream flow data to help water resource managers and water service utilities.
The dashboard was informed by utilities around the country who provided input on critical datasets used for resiliency planning. It provides information that will help utilities, water planners and other water resource professionals make informed decisions when facing extreme weather conditions using the real-time data and weather maps.
Operators can check data specific to their area and make decisions for their facility based on the current and predictive modeling data presented. Several of the datasets include case study links that take users to other parts of the Climate Resiliency Toolkit and show real-life examples of how communities are using climate data in planning for resiliency.
It is designed for audiences that need both short and long-term forecasts with the number of datasets on the dashboard evolving with users' needs. The Water Resources Dashboard has data for all inclement weather conditions. It’s organized into three categories: observations; forecasts and outlooks; and people and assets. Some of the tools the dashboard offers include the ability to:
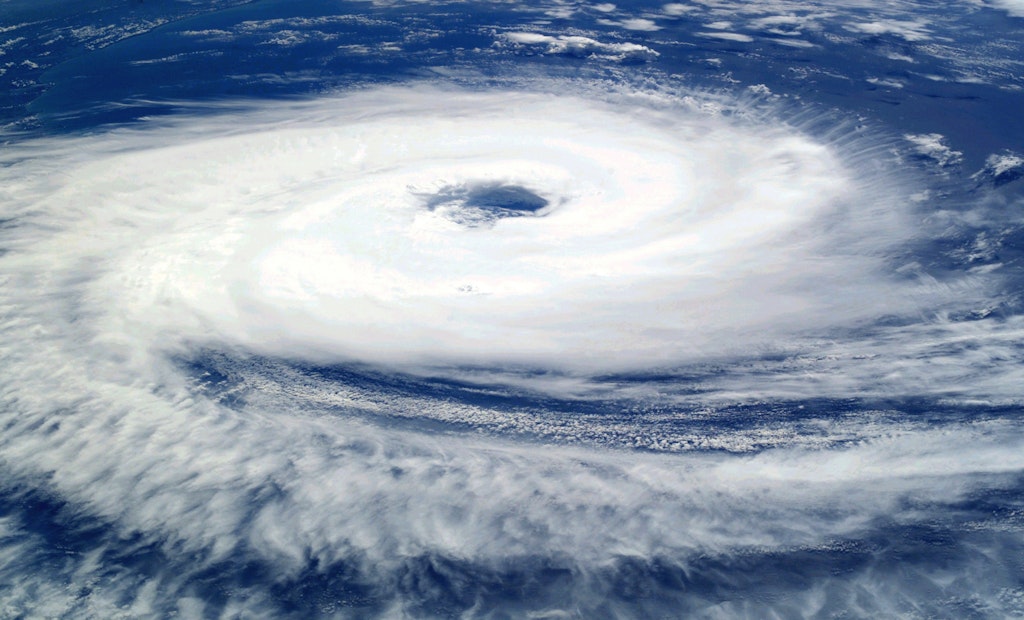
- Predict tropical weather including the path of hurricanes, track their progress, and determine when communities are risks;
- Observe river conditions, monitor flood risks and assess river levels and the corresponding flood vulnerability for communities using the National Water Model;
- Use the Precipitation Outlooks to find the probability for precipitation and temperature changes in real time;
- See where droughts are likely to develop using drought early warning information systems; and
- Find the chances for severe weather over an eight-day span including tornadoes, thunderstorms, winds and hail in the Storm Prediction Center.
The Water Resources Dashboard is a one-stop website for information on relevant water data. It aims to help operators and other stakeholders make their communities more resilient to extreme weather events. It also connects to other hazard-related sites like the U.S. Drought Portal, and others relating to soil and snow cover. New data and case studies will be added as the needs of stakeholders change.
WE&RF, Association of Metropolitan Water Agencies, NOAA and other partners are hosting an online learning series featuring scientists and utility decision makers to help other users understand how the data can be applied and how other facilities have utilized the information to make decisions for their community. The online seminars are recorded so users can access them anytime by clicking “View Tool Demo” under a dataset.
The Water Resources Dashboard is available through the NOAA U.S. Climate Resilience Toolkit. For more information about the Water Resources Dashboard, contact Katy Lackey at klackey@werf.org.


