Asset management software helps municipalities keep track of extensive infrastructure systems: history, specifications and maintenance.
Such software uses the power of personal computers to store libraries full of information that can be used to assess conditions, track breakdowns, prioritize repairs and manage the flow of work to keep the system in top condition.
VUEWorks Inc. of Concord, N.H., has introduced VUEWorks, a Core application and a series of software modules to enable managers to monitor and analyze data about water, storm sewer and sanitary sewer systems. The software operates on top of geographic information system (GIS) databases and uses map graphics produced by the Environmental Systems Research Institute Inc. (ESRI) of Redlands, Calif.
On Sept. 2, VUEWorks vice president of sales and marketing Alex von Svoboda, territory sales manager Ken “Chip” Spalding, and vice president and product manager Rod Lovely conducted a 90-minute demonstration of the software in a conference call aided by Web-based meeting software.
Walk-around
VUEWorks uses a graphical interface that is typical of modern Windows-based software. It is Web-based, operating over an organization’s internal network and operated through an Internet browser, typically Internet Explorer.
That enables access by authorized users from any browser-equipped computer without the application being installed on the machine. This makes it possible, for instance, for service workers to use the application from laptop computers in the field as long as they can log into the internal network, such as through a wire-less connection.
VUEWorks presents a map of the community’s infrastructure assets and then uses that map to give users access to extensive information about the assets, drawn either from the internal software database or from existing in-house databases.
Users log in with a user name and password from the Windows desktop. The software then opens in an Internet browser window. The standard home page interface is dominated by a map of the municipality covering the right side of the screen. On the left side of the screen are two separate windows. The upper window, the Menu View, is a list of folders that can be clicked to activate specific databases and functions. The lower window, the Data View, is a workspace generally used for data reading and data entry.
The map can be generated by any number of GIS applications. In VUEWorks, it can be clicked to call up specific information about particular infrastructure assets being managed, such as a sewer system. Features on the map can be linked to documents in external database files, such as inspection reports or photographs. Alternatively, specific assets can be opened by clicking on appropriate folders in the Menu View.
The Menu View can be configured based on the VUEWorks customer’s specific needs. Items that might be in the Menu View include administration, document link, data link, service calls, work orders, resource manager, valuation, sanitary sewer, storm drain, and water and hydrants.
The application can manage a wide range of asset collections, and users can turn on and off different layers in the map interface so that they can see many sets of assets, or only one, such as a sewer system network.
In addition to the Core software, additional modules are available to enable such tasks as maintaining inventory, connecting to other databases, managing service calls, tracking financial metrics such as depreciation expense, and planning capital projects.
Operation
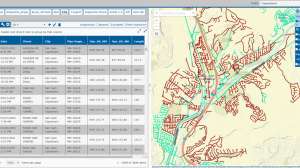
After a PowerPoint presentation on the VUEWorks features and benefits, von Svoboda and Spalding started the VUEWorks software. It opened on a map with a closeup of a neighborhood in a model city (Figure 1).
Spalding maneuvered the cursor over the map to a land parcel and identified its address. The Data View in the lower left corner of the screen offered information about the site, organized in a series of tabs. Tabs associated with a parcel can include attributes drawn from the GIS, such as the land dimensions, the street address, and information that might be in the plat book for the parcel; documents associated with the parcel; and other possible databases, including service calls, work orders and billing data.
Spalding clicked on the documents tab to bring up a directory of documents associated with the parcel. One was a document for the site’s water service tie; Spalding clicked on it to open a record of the document.
Von Svoboda explained that VUEWorks uses attributes from the ESRI database to link to other databases in which scanned documents or images or other pieces of information may be stored. The only requirement is that the other databases are compliant with standards for Open Database Connect-ivity, or ODBC.
In the field, Spalding explained, this feature could be used on site to quickly research the records on a location that requires a trouble call, such as a leaking water main. “We bring all that information, whether it’s scanned or whether it’s databases, to the fingertips of someone who might need it out in the field or in the office,” he says.
It is possible to set up the Data View tabs so that, for instance, billing and account data can be retrieved from external billing and account management software.
Spalding demonstrated an alternative way to gain access to data on a parcel. Clearing the existing parcel from the Data View window, he called up a search field and typed in the name of a property owner (Figure 2). The search found a water service and a sewer service card for the customer. (It is also possible to search by other attributes, such as street names.)
In addition to locating information by individual properties, the system can allow users to select an asset from the map, such as a stretch of sewer pipe or a lift station (Figure 3). The Data View then shows information and links to other databases pertaining to that asset.
Among buttons on a tool bar at the top of the map screen is one that controls the various layers of information visible on the map (Figure 4). Spalding clicked on the button, opening a menu showing the layers, then cleared all but the municipality’s lift stations.
He then used the Data View search function again on the name of a particular lift station. The search highlighted the station on the map and produced a series of tabs in the Data View window associated with pieces of information about the station. Documents, including a photograph of the station interior, were among the items stored there.
Von Svoboda noted that motion-picture files in the AVI format, such as from a televised sewer inspection, can be linked to the asset’s data through VUEWorks (Figure 5).
Information that doesn’t already reside in external, ODBC-compliant databases can be entered in the software’s own database, which is programmed using Structured Query Language (SQL), a standard database programming language.
Spalding concluded the demon-stration with a brief review of how the software can assist in calculating risk assessment for particular system components and capital expenditures for repair projects. For operators in the field, the software can be set up to produce prompts for users to enter information about various conditions of an asset.
VUEWorks also prompts the operator to enter information about projected risks assigned to a component, enabling rapid calculation of such things as the impact of a failure in a particular part of the system. Another module includes prompts and data entry fields that can be used to calculate repair costs for a component, assign equipment and supplies for a repair job (if they are logged into inventory databases that can be accessed via VUEWorks), and project various kinds of budgetary scenarios.
Observer comments
The visual nature and the familiar look of VUEWorks makes it appear easy to use and learn intuitively. Indeed, the complex discussion of how it works, complete with rapid-fire reference to various kinds of computer-software terminology not readily known by many average users, may make it more intimidating at first than simply picking up a keyboard and mouse and poking through the system.
Manufacturer comments
The modular structure of the software allows purchasers to start out with the Core system and expand as needed. The Core system allows users to load GIS-based asset data and use a map interface to focus on assets or parcels within the user’s purview; link electronic documents including photographs, drawings, plans, permits, forms and other information to assets or map features; move, add or delete assets; and link to other databases, von Svoboda explains.
Additional modules can enable more sophisticated and complex tasks, from managing work crews to assessing capital costs or assessing the risks to infrastructure components. They include the Resource Manager, which enables a range of tasks associated with tracking and administering work orders, such as assigning personnel and equipment, calculating work costs, notifying crews of work order assignment, adjusting inventory supplies, and configuring work flow. Other specialized modules are designed for water, sewer and stormwater collection systems.
“A lot of people want to start out with the Core, Service Call, Work Order and maybe Resource Manager modules,” von Svoboda says. “Later, they may go higher with risk assessment and evaluation modules.”
Because VUEWorks typically resides on a central server and is accessed via a browser, it is not licensed based on how many machines it is installed on, but rather on the basis of how many authorized users it has.
Continue reading for free