Pipe inspection software continues to get more sophisticated. Features that allow the recording of data while a video inspection proceeds have become routine. Today’s more advanced programs also provide capability to interface with widely used asset management software and geographic information systems (GIS).
One such offering is the flexidata-GIS module from Pipe-Logix Inc. of Palm Desert, Calif. It was the first module with capability to link a user’s existing GIS map data into the inspection database. Joan Stone, PipeLogix president, demonstrated the latest version of that system in a Web-based conference on Feb. 17.
Walk-around
Flexidata-GIS looks and acts like a standard Windows-based application. Typically launched from a desktop shortcut, it opens to a browser window consisting of a left-hand pane that is a directory of folders and a larger right-hand pane that is the usual work space. A menu bar and a toolbar offer standard options for accessing and working with files, creating reports, searching, printing and deleting.
Folders in the left pane take the user to various individual inspection projects and databases for pipes, laterals, nodes, CCTV inspections, lateral surveys, and others. To provide adequate computer power to work with GIS mapping files and stored inspection video, the company recommends computers be equipped, at minimum, with dual-core processors and at least 2 MB of RAM. It is assumed that most data, particularly video, will be stored on terabyte servers on a network.
Operation
Stone demonstrated a series of operations. She began by showing how flexidata-GIS can import data from existing shapefiles. Stone clicked on a shortcut icon and entered a user name and password. The program’s browser opened, defaulting to the projects list and opening the folder for the database used most recently, in this case: GIS PACP DEMO.
Stone moved the mouse cursor down to an icon for a new simulated project, New Map, then imported map data for the project by choosing “import” from the project menu at the top of the browser window. The import feature lets users choose whether to import all assets, select assets by query, select assets by map, or import the information as a visual layer.
Stone selected all assets (Figure 1). After she clicked Next, the program presented a verification dialogue in the form of a pull-down menu listing several types of assets — pipe, manhole and lateral — as well as options for Visual and Rastor layers.
She selected an appropriate template (most users, she said would have just one or two templates for importing data) to map the fields from an existing shapefile into flexidata. Stone explained that the function could be used to import both data and a map or just one or the other. Proceeding with the operation would import all the assets into the flexidata pipe tables, lateral tables or manhole tables. (Because a typical import takes about 20 minutes, Stone did not actually complete that part of the procedure.)
She then showed how the system is used to enter information for an inspection project. Back in the flexidata browser, she chose the New Map folder and went to an item nested within it called CCTV to simulate creation of a new survey. Clicking on the New icon brought up a data entry form (Figure 2), requiring inspection information to be listed in the NASSCO-PACP format.
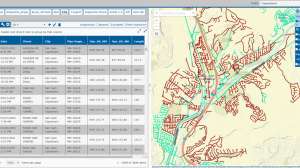
Once data in the project form were completed, Stone clicked on a map icon on the form’s toolbar to open a map of a city’s sewer assets. One segment of sewer line was highlighted as having already been surveyed; Stone used the cursor to draw a square around that area on the map and zoom into it. In a pane in the upper left corner, she then opted for a view showing the direction of flow of the sewer.
Stone used the map to select the pipe for inspection (Figure 3), and the pipe was then highlighted. Returning to the survey project form, she filled in a field asking whether the survey would go upstream or downstream; she selected downstream. With the selection, the application automatically filled in the start and finish manhole on the form and pulled information on the diameter, material and total length of pipe from the database. Additional fields included information for the inspector’s name and PACP certificate number, what form of pre-cleaning was required, and others.
Stone then simulated entry of data during an inspection, entering information as if proceeding from the entry manhole. If an actual camera had been operating, it would have fed footage information automatically to the database. She simulated entering data from a fault, and then clicked to finish the survey. To show the storage of data from an actual survey, Stone returned to the browser and retrieved a different, completed survey already associated with a video recording.
To simulate how an engineer back at the office might use the data collected in the field to do a follow-up review of the findings, Stone used data from the actual inspection and exported the information to a shapefile, working from the flexidata-GIS browser window. Exporting was quick: From the menu bar at the top, Stone chose survey, then export, leading to a series of menus from which she chose specific exporting options (Figure 4).
The procedure exported the information as a layer. Once the information was exported, Stone left the flexidata-GIS program and started a different program, Arcmap, to which PipeLogix has added a special flexidata-GIS toolbar. Stone used that to link back to the flexidata database.
Navigating to the map of the neighborhood where the inspection was conducted, Stone showed how the map image of the inspected pipe highlighted areas that had been recorded during the inspection. Conditions recorded during the inspection appeared here as dots on the stretch of pipe, and the information was readily available by clicking on the segment.
Using the flexidata toolbar in Arcmap, Stone then retrieved images from the inspection itself. Selecting another layer in the database, she searched for pipes with cracks, which showed up in red. When Stone selected one to review more closely, it turned turquoise. By clicking on the Reports button on the Arcmap flexidata toolbar, Stone opened a PDF of the selected pipe’s inspection report.
Stone explained that when using Arcmap with the flexidata toolbar, a supervisor can select specific areas for surveys. Using the mouse to draw a box around a neighborhood and zoom in on it, she clicked on a button on the toolbar to create surveys.
The system automatically set up surveys for 36 segments of sewer line in the neighborhood (Figure 5). Returning to the flexidata program, she then showed how the application had automatically begun filling in location information for survey forms corresponding to each survey (Figure 6).
New projects can also be created in flexidata without going to Arcmap. In flexidata, Stone clicked on Options, then chose Map Manager. That feature lets the user link the map to the layers needed for the inspection project.
Observer comments
As with many software applications, flexidata-GIS appears likely to take a little time to understand its structure so that users can become comfortable with it. The linkage of data on inspections directly with map information offers a powerful visual key that is likely to be helpful in managing infrastructure, and especially in coordinating project locations for maximum efficiency.
Manufacturer comments
“The key component a city needs to get this all to work properly is GIS files with data behind them and upstream and downstream manhole numbers for every pipe,” says Stone. Users can import asset databases into new flexidata databases or use the software with existing databases. This gives users with older file systems access to the program.
A few of the features could not be shown because the demonstration was conducted online and because the demonstrated software was a beta version of the newest edition of the application, according to Stone.
The software’s standard license covers a desktop user, with full reporting, and a truck supervisor with light reporting. The license is enforced with a key inserted in the USB port, so one license can be used on more than one inspection truck so long as they are not simultaneous. Stone recommends that data be stored on a network to allow maximum access to the information it contains.
Continue reading for free