Inspecting large sewers can be inconvenient and costly, in part because taking an interceptor line out of service for traditional crawler-based inspection requires extensive bypassing.
Furthermore, major interceptors commonly have access points spaced at 1,500- to 3,000-foot intervals, too long to inspect with camera vehicles pulling heavy video cable. Many access points are also off-road.
Large sewers can be inspected while in service using cameras on floats, but because a video camera can’t see below the waterline, the inspection is inevitably incomplete. In such cases, other tools can be used to assess pipe conditions both above and below the waterline.
Laser profiling looks above the waterline and accurately determines pipe ovality and alignment. Sonar profiling, meanwhile, looks below the water to measure structural dimensions as well as debris levels, grease accumulation and pipe capacity.
CUES Inc. has combined three technologies — digital high-definition video, laser and sonar — in its FlyEye inspection and evaluation system. All the inspection tools are mounted on a single float that can be used for continuous inspections up to 4,500 feet, or even longer. With this combination of technologies, the system can collect and process data on a complete range of pipe conditions.
The inspection provides a true 360-degree report on conditions regardless of flow level. Digital reports with digital images provide a complete package to help identify defects and rank their severity. The data can be used to help plan pipe cleaning and rehabilitation programs.
Ed Diggs, manager of business development for CUES, gave a demonstration of the FlyEye data and its analysis software in an Internet-based presentation on Aug. 13.
Walk-around
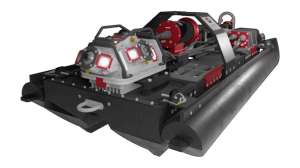
The FlyEye inspection device travels on a pontoon float. It is deployed into the pipe from an access point and travels downstream, typically pulled by a drift sock that keeps the float centered in the pipe. It is tethered to non-stretch polyethylene marine rope (usually 5/32-inch in diameter) wound on a reel. The rope runs through a footage counter. The reel can be used to regulate travel speed and add stability.
For deployment through a standard manhole opening, the side pontoons are removed, then reattached once the unit is inside the manhole. The unit weighs about 120 pounds and requires a winch for deployment.
The sonar unit is attached below the pontoons and the laser profiler, with four analog cameras, sits on top, along with the video camera, which looks back (upstream).
The system uses no video cable. Instead, the camera, laser profiler and sonar profiler operate off separate battery packs, sized for 3.5 hours of operation, and record to separate 15 GB hard drives, creating a fully self-contained package.
The video camera captures images six times per second in resolution about eight times greater than for conventional pipeline video. Laser data is collected 12 times per second and sonar readings are taken once per second.
At the end of an inspection run, a grapple lowered into the endpoint manhole is used to catch the unit and lift it out of the sewer.
After an inspection, data from the hard drives is downloaded and reports are created using sophisticated software that integrates all three types of images. Reports, typically provided within a week after completion of the field work, provide pipe cross-section images every 50 feet, and at all problem areas as identified by CUES engineers.
Operation
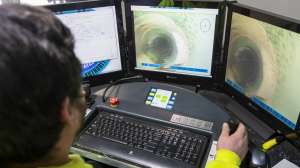
The demonstration did not include observation of system deployment and data recording. Instead, it focused on the system software and the reports and integrated 3D images the customer receives.
Reports include a summary table showing an overview of the inspection and basic observations and comments (Figure 1). Individual report pages on specific observations (Figure 2) show:
• A high-definition image of the actual pipe at the point of the observation.
• A 3D color-coded laser-sonar scan image showing the entire pipe interior, including the water level and the debris at the pipe bottom.
• A laser-sonar profile scan showing the pipe profile as measured versus the original shape of the pipe.
• A graph of the pipe as if split down the middle and laid out flat with the 12 o’clock position in the center and the 6 o’clock position at the top and bottom.
The individual images are correlated with the point on the flat graph to which they correspond, delineated in footage from the inspection entry manhole.
Color-coding on the laser-sonar images lets reviewers see at a glance the condition of the pipe. For example, red areas signify significant wall loss, such as from hydrogen sulfide erosion, and blue indicates significant debris buildup in the pipe.
The laser profile image shows quickly how far the pipe deviates from its original shape at the point in question. For this illustration to be meaningful, the customer must supply an accurate representation of the pipe profile as installed for entry to the software.
Reports also include a debris diagram (Figure 3) that shows the depth of debris (as identified by the sonar profile) versus the water level along the entire length of the pipe section inspected. Also included is a calculation of the average debris depth and the total debris volume in the pipe.
“This tells them how many cubic yards of debris the pipe contains,” says Diggs. “If they know they have 40 cubic yards of debris in a pipe, and if their normal vacuum truck load is eight cubic yards decanted, they know they’re dealing with five truckloads,” says Diggs. “Or, if they simply want to knock down the debris in some of the higher spots, they can identify those spots and jet across the top. It makes the cleaning process much more efficient.”
Finally, the report includes a video called the Four-In-One. A single screen displays the pipe video, laser and sonar images running to-gether as the float proceeds through the pipe. Below those images is the color-coded flat graph with a marker that indicates the float’s position at any time during the video.
Observer comments
The FlyEye system provides information in formats that appear easy to understand even for a relatively untrained eye, and especially for experienced engineers or pipeline maintenance technicians. It offers a holistic view of interceptor condition that could not be obtained with any one inspection technology by itself.
Manufacturer comments
Diggs notes that the FlyEye system is designed to give communities data that helps them thoroughly understand the condition of large sewer pipes. That includes an assessment of system integrity as well as pipe capacity and debris levels.
“It provides all the tools they need to make informed decisions effectively and efficiently,” says Diggs. “We created it to be operator-friendly and easy to use.”
Diggs notes that the long pipe runs enabled by the self-contained, battery-driven system enable users to avoid taking heavy equipment to access points in environmentally sensitive areas.
A key attribute of the system, he says, is that it provides a report on which utility engineers can see sonar, laser, video, and a flat graph of the inspected pipe on a single screen, without having to toggle back and forth between views. “They get it all at once in a format that makes it easier to see the whole condition of the system,” Diggs says.
Continue reading for free