Data management is becoming more important as municipalities continue to see budgets tighten. A new module for WinCan infrastructure inspection and asset management software ties inspection data and CCTV results to a geographic information system (GIS) to help municipal staff manage the infrastructure, create mapped projects, easily dispatch work crews, and view more complete infrastructure detail in GIS maps.
The software was created by CD Lab AG of Switzerland and is distributed by Pipeline Analytics, the exclusive sales, training and support organization for WinCan software in North and South America. “It visualizes your CCTV data in GIS,” says George Brown, GIS manager for Pipeline Analytics, who helped develop the software. “You can plot observations to make GIS data more accurate and even add more data into GIS.” Brown demonstrated the GIS software model via Internet meeting on Aug. 23.
An older version of the GIS module required municipalities to have WinCan installed in the office, according to Pipeline Analytics account manager Mike Russin. That is no longer the case. “You can load WinCan data from the field into this utility in the office,” he says. “You do not need a WinCan license or WinCan Viewer.”
The software is ArcGIS 10 and 9.3 compliant and is designed to be used with dual computer screens. “It is set up for the person who maintains the GIS system,” says Russin. “CCTV data is collected on lines in the field. It comes back to the office on a hard drive or thumb drive and is loaded into the GIS.”
WinCan GIS can export and integrate to most database programs, as well, including Access, SQL and Oracle. One customer of Pipeline Analytics connects the GIS data with an ArcGIS Server intranet site so that the information can be viewed online.
The WinCan GIS module creates a toolbar within the GIS system, such as ArcGIS. That is what Brown, a former consulting engineer and certified GIS professional, used for the demonstration.
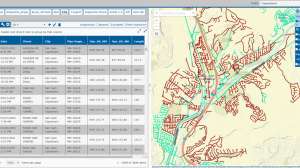
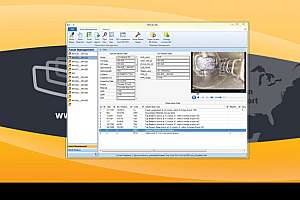
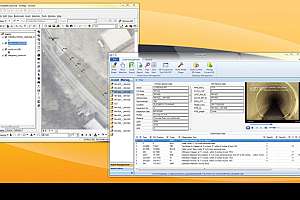
A click on the toolbar brought up the WinCan data showing pipe information such as upstream and downstream manholes, pipe segment length, taps, and all inspection observations. (Figure 1)
Videos and pictures are also displayed on screen. One click will bring up the video or pictures alongside the inspection findings. “Engineers need to see this data visually,” says Brown. “Instead of watching videos for hours and hours, we integrated it with GIS to create a tool to do everything that engineers were doing by hand.”
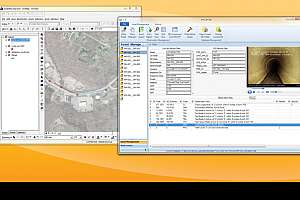
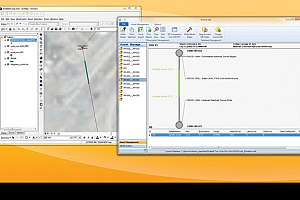
Brown selected one specific pipe in the WinCan GIS module, and it was immediately highlighted on the GIS map on one screen while the pipe’s inspection findings and other details were displayed on the other screen. He then demonstrated how it works in reverse; selecting a section of pipe on the GIS map brought up that pipe’s information on the WinCan module. (Figure 2)
There is also a tool to compare pipe information in WinCan to that in the GIS system to assure accuracy. “The guys collecting the WinCan data have the freshest information,” says Brown. “They know if the pipe is 8 inches or 10 inches, and if it is made of terracotta or reinforced concrete.”
Selecting the comparison tool brings up the data from both, such as location, street, and date installed. In the demonstration, the WinCan data said the pipe was concrete, while the GIS data said it was terracotta. “The WinCan tool does not automatically change the GIS, but it highlights the disparity,” notes Brown. “It’s set up so a GIS operator decides whether to make the changes.”
Brown noted that with his GIS background, he would not want any software tool automatically changing data he had gathered and entered. “The GIS operator can look at the pictures and videos from WinCan to confirm the information before changing data in the GIS,” he says.
The tool allows the GIS operator to see the inspection findings in WinCan. It also will map the location of each finding on the GIS map. “Infiltrations, broken taps, they all have a location along a pipe,” says Brown. “I want to be able to visualize them, and WinCan GIS has a tool to do just that,” said Brown.
With a single click, Brown chose that tool, and the GIS map displayed labels for the upstream and downstream manholes for that length of pipe, along with the specific location of each inspection observation, and a label. “That takes a lot of programming and was one of the hardest things to do,” he notes. “The findings are visible with a single click.” (Figure 3)
If, for example, a city was planning a project to clean roots from all sewer lines, the data for all pipes could be searched to show just inspection findings dealing with root intrusion, and that data could be saved as a separate file. “It creates new GIS data from the WinCan data with all of the WinCan attributes, and you could set up a root program for the summer,” he notes.
An engineer could use the integrated data to plan a repair strategy for a pipe. Brown selected a pipe that needed a CIPP repair. The GIS map displayed its location, including the associated manholes and the location of the area needing the repair. On the other screen, the inspection findings were visible along with the inspection video.
With a click, a repair strategy page is displayed to facilitate planning of the work. The engineer can choose where to begin and end the specific repair. (Figure 4) If the operator knows about how much CIPP, pipe bursting and other repairs cost per foot, it is possible to create a rough estimate of the project cost. The location of the repair can be represented as a feature in the GIS and incorporated into an organization’s GIS.
Using a filter button in the WinCan module, Brown filtered all the pipes by criteria such as maintenance grade and structural grade. Selecting Maintenance Grade 2, he brought up every such pipe in the database. By selecting the list and clicking a button, he exported the data to an Excel spreadsheet showing all the information for each pipe in that category and the location of inspection videos and pictures.
Once the inspection data is integrated with GIS, it is possible to create a WinCan mission plan for pipe inspection that can be saved for future inspections. Brown selected all the pipes on one street. “This will produce a prepopulated WinCan database,” he notes. “When it’s exported, all the pipe information will be filled out so the people in the field only have to collect observations.”
If an error in the database is found, such as incorrect pipe diameter, it can be corrected in WinCan. That error will then be visible when the inspection data is imported back into GIS. “Manhole numbers can be anywhere from six to 10 characters long,” adds Russin. “Reading that off a map and typing it in the field can generate a lot of errors, so this eliminates that problem.”
This saves time in the field and it aids in the management of CCTV projects while preventing the introduction of bad data to the inspection database and GIS maps.
With some training and practice, the WinCan GIS module is an intuitive program that integrates a lot of information into a format that is both easy to understand and easy to navigate.
GIS is a powerful tool in itself. Being able to visualize pipe information and repair needs in such an environment can simplify the process of managing important infrastructure.
“People have made a big investment in CCTV data,” says Brown. “This is a powerful way to mine information from that data and get it into your GIS.” He notes that WinCan GIS helps municipalities be more efficient in turning that data into repair plans and budgets.
The software also helps engineers make better decisions about repair strategies. The pre- and post-inspection data is suitable for submission to regulatory agencies to provide visual and electronic evidence that the proper repairs have been completed, Brown states.
Contractors can also offer the data as a deliverable for customers. “You deliver WinCan data, and you can take all that information and create a GIS file of your observations,” says Brown. Not only is it a better product with more information, it has more value for the customer, so they will be willing to pay more.
“It’s simple and clean, yet very powerful,” adds Russin.
Continue reading for free