Flow monitors are critical tools for overseeing both sewer collection and water distribution systems, and successful interaction requires software that is reliable and easy to use. ADS Environmental Services in Huntsville, Ala., an IDEX water and wastewater business, is offering Qstart, a new software package for setting up and activating the company’s FlowShark Triton, FlowAlert, and RainAlert II flow monitoring systems.
Lynne Reynolds, quality control and technical documentation manager for ADS Environmental, says Qstart was designed to be easily accessible to new users and thereby add value to the company’s flow monitor product line. Qstart is downloadable for free from the ADS Environmental Services website. Reynolds hosted a demonstration of the system over the Web.
Qstart has a standard Windows-style interface with various screens, buttons and drop-down menus to make its features work. It includes screens for setting up and configuring a utility’s flow monitors as well as for viewing data returned from monitors in both graph and table form. An extensive help file included in the installation provides answers to a wide range of user questions.
Using information from an actual sewer flow monitoring site in Huntsville, where she was speaking from and where ADS is based, Reynolds began by showing how a monitor would typically be activated with the Qstart software. She double-clicked a Qstart icon in the lower left-hand corner of her computer screen, launching the program. Qstart’s first screen includes two panels in the upper half and a single panel in the lower half. To the left, below the lower panel, is a Settings button.
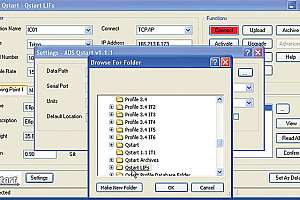
Reynolds clicked on the Settings button to show how the software can be configured for a monitor. For a user setting up the software, the first action is creating a data-path for the information on each flow monitor. The data is stored in Location Folders containing Location Information Files (LIFs). Reynolds clicked on Settings, which opened a Windows Explorer window showing a number of folders related to Qstart and other flow monitor software applications.
In many instances, Reynolds said, users might install Qstart after already having installed and operated ADS flow monitors with the company’s earlier and more complex software, called Profile. Data created in a Profile installation can be used directly by Qstart, she said.
Reynolds browsed to a folder called “Qstart LIFs” and clicked on it, thereby associating the program with the individual monitors whose information was contained in that folder (FIGURE 1).
She then proceeded through the rest of the Qstart activation. The required steps include defining communication ports on the machine hosting the program. This facilitates both serial and landline communications with the flow monitors.
The system allows users to choose if they want data delivered in U.S. units or metric units. It also allows users to choose whether to save data in an ADS proprietary format, in comma-separated value (CSV) files that can be imported to a spreadsheet, or both. Reynolds chose “both,” but users who don’t plan to acquire the Profile software can opt for data to be saved just in CSV files, she said.
For a new monitor to associate with the software, the user selects the model name and details of the ADS flow monitor to be used from a drop-down menu. Additional selections are made for the frequency with which the monitor takes readings, such as every 2, 5, or 15 minutes, and information is logged on the shape and size of the pipe where the monitor is installed.
Reynolds selected FlowShark Triton and entered the unit’s serial number in a designated field. She selected a 5-minute frequency for the monitor to test, and because it was going to have a wireless Internet connection to the monitor, entered an IP address for the unit.
When selecting the pipe size, the application defaults to 24-inch pipe. Reynolds selected 36-inch pipe for the monitor being associated. In addition, because the pipe has been in use for a long time, she made adjustments in the software to reflect the pipe’s slight change in diameter: 35.625 inches high and 35.5 inches wide. That information is normally taken by a field crew when the monitor is installed or inspected at the site.
“We recommend that you take both a height and a width measurement of your pipe,” she said.
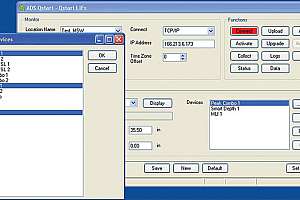
After setting other parameters for the pipe where the flow monitor was installed, Reynolds further configured the software for the specific monitor’s multiple sensors (FIGURE 2). For this monitor, Reynolds selected a Peak Combo sensor, which includes ultrasonic, velocity, pressure and temperature sensors.
She also selected an appropriate flow device as part of the configuration. The flow device enables the monitor to calculate the quantity of flow, which Qstart cannot do on its own. Because she was selecting multiple devices at this stage, Reynolds held down the computer’s Control key and used the mouse to click on each device she was choosing.
Clicking on the View button for each sensor, Reynolds confirmed that each was set to the appropriate parameters. As she selected a device and clicked on View, a new screen opened showing that device’s various parameters.
Because the sensor in question was offset from the bottom of the pipe by one inch when it was installed, Reynolds entered that information in an appropriate field in the application. She made no other changes to the sensors’ parameters. She typically recommends retaining the default settings at first, changing them only if abnormalities in the data indicate the need for doing so.
Reynolds proceeded in the same way to configure additional sensors that were part of the monitor being activated.
Once configured, Reynolds clicked on an Activate button on the software to activate the flow monitor, and the software connected wirelessly to the monitor.
When Reynolds had originally entered the unit’s serial number in the software, she made a typographical error. Now as the software connected to the actual monitor, it detected the discrepancy and gave her an opportunity to choose which number — the one reported by the monitor or the one she had entered — was correct. Realizing her error, Reynolds instructed the software to change the number she had entered to the one that was already associated with the actual monitor.
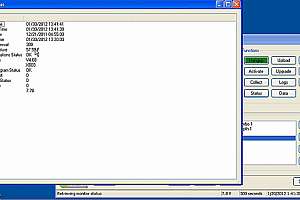
The software then uploaded its configuration information to the monitor itself. Since the monitor had already been in service, Reynolds was able to click one button and see the volume and age of data already in the monitor’s memory (FIGURE 3).
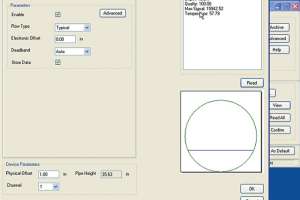
She then clicked on the View button, which allowed a check of the data from each of the sensor devices in sequence. For the Peak Combo sensor array, it showed a schematic of the pipe where the monitor was located (FIGURE 4).
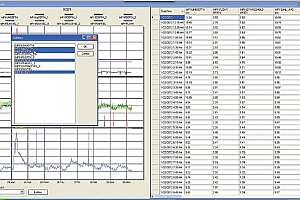
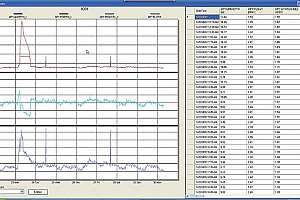
For a history in graphical form of the flow monitor’s readings, Reynolds clicked on a button labeled Data. The first view (FIGURE 5) showed several different variables from the flow being monitored. The information was also visible in tabular as well as graph form.
Reynolds selected a limited number of monitor variables to show so that it was easier to interpret the graph results (FIGURE 6); the change had no effect on the tabular view, however, which continued to make all the data visible.
In the graphs, the effects of a major rain on Jan. 23, eight days before the demonstration, was immediately visible.
“This particular pipe was a 36-inch pipe, but you can see the flow depth got all the way over 100 inches,” she said.
The tabular data also can be sorted in a variety of ways.
The software interface is clean and easy to understand. Its labels and menus are intuitive and appear quick to learn. Various built-in features that correct errors (such as the serial number error Reynolds encountered) are likely to be very helpful.
As demonstrated, Qstart responded quickly to commands and did not appear to put a significant drain on computer memory.
Typically, software makers develop new versions and products that are more complex than their predecessor applications: loaded with more features and taking up a bigger and bigger footprint on the computer. In that way, Qstart represents a refreshing change of pace — trimming down the product so that it is easier to use rather than more complex.
“In the past, we’ve had a very full-featured software product that activated and configured and collected and then analyzed the data,” Reynolds noted. “But for a new user who’s not really familiar with our flow monitors, it had a steeper learning curve.
“So this was developed in response to the voice of the customer surveys that we did to come up with a program that enables a user to configure and activate a monitor in less than five minutes. And once you know what you’re doing, it’s about a two-minute process.”
Continue reading for free