The DuPage Water Commission, a wholesale water distributor in DuPage County, Ill., decided to upgrade its information management system of hand-drawn maps, road atlases and corporate memory.
Following an engineering firm’s recommendations, the commission defined the necessary geographic information system (GIS) layers and datasets, consolidated data, and hired GIS coordinator Frank Frelka. With a background in public works, Frelka first tried to adapt the system to a water distribution data model, but it wasn’t a good fit.
“We had 27 customers, not thousands,” says Frelka. “The feature classes such as service laterals, fire hydrants and commercial and residential customers didn’t apply to our small-scale water distribution network.”
Frelka clued in to the language used by personnel in the pipeline division. “They always talked about stationing along the pipelines,” he says. Remembering a presentation at an ESRI International User Conference, Frelka visited the company’s Web site and found the ArcGIS Pipeline Data Model (APDM). It met the commission’s primary objective to account for linear referencing of features.
Frelka extracted the 15 feature classes he needed and defined an additional 20. Recalling an old saying about doing something the right way, the wrong way and my way, Frelka did it his way. “With guidance and the template provided by the APDM, it’s working out fine,” he says.
Learning curve
APDM can hold dynamic events and static features. “It took some thinking to realize that events are used for dynamic situations,” says Frelka. “Ours was a static situation.” Starting with as-built drawings of the nearly 200 miles of water mains, Frelka converted the data into the GIS.
He eyeballed pipelines using the county’s centerlines and aerial photos. The pipelines were snapped to GPS points taken by survey every 500 feet and at every visible structure, such as manholes and electric cabinets. Frelka created routes from the pipeline features by using more than 400 known locations of valves and manholes.
“I converted the lines to routes, then assigned measures to the lines,” Frelka says. “I had to learn how to calibrate routes working from known locations along the route with associated station values based on linear feet.” Since the terrain is flat, he used flat 2-D linear stationing. “Things became complicated with station equations and routes,” he confesses.
Substantial savings
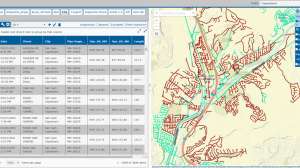
Next, Frelka developed an event table of asset locations from the as-built drawings. Columns included elevations, station values, valve locations, manholes, bends in the pipe, blow-off valves, system valves, CP test stations and casings. He imported the table into ArcMap. With linear referencing, he developed an ArcIMS application that opens as-built drawings for a selected section of pipeline.
“I started with event tables because all we had was tabular data,” says Frelka. “Using an event table enabled me to create feature classes. Because the system is static, it lends itself to out-of-the-box tools.”
The task initially appeared daunting, but after reading the book, Linear Referencing in ArcGIS and completing the exercises, Frelka had the knowledge he needed. His next objective is hydrating the additional feature classes with information and populating a leak table.
The commission also plans to integrate its GIS with the enterprise asset management system and document management system. Frelka estimates that using ESRI’s ArcGIS data model instead of a consultant proposal that included database design saved the DuPage Water Commission at least $8,000.
Continue reading for free