It’s an understatement to say the City of Long Beach Water Department is passionate about Geographic Information Systems (GIS).
The department, responsible for the potable water and reclaimed water distribution and wastewater collection for a California city of 493,000, has incorporated GIS and methods that go well beyond the technology’s original purpose. The department has created a dynamic, organization-wide system that helps the staff manage day-to-day maintenance, scheduling, long-range capital improvement planning, and the tracking of all assets’ health and performance.
Blazing a trail
The department was quick to jump on board with GIS in its infancy: It began integrating the technology in 1994. Although GIS was new then, the Engineering Bureau quickly saw its long-range potential and championed its use throughout the organization.
When selecting the GIS platform, the Engineering Bureau found it critical to have as many people as possible from all bureaus involved in developing the needs assessment documentation. Selection criteria included:
• Ease of use.
• Ability to customize.
• Compatibility with other software and operating systems.
• Product reputation and industry acceptance.
• After-sales technical support.
• Overall cost of ownership.
The department chose ESRI Inc. and adopted the ArcMap, ArcView, ArcInfo, ArcIMS, ArcGIS Publisher, SDE, EDN and Spatial Analyst software components and made a major investment in hardware, including servers with 100 networked PCs and 20 field-use computers.
“During the early transition from our paper-based system, many employees were not enthusiastic about using GIS because it was new and complicated,” says Albert Lin, GIS officer for the department. “They had been doing their work with a manual, paper-based system for so many years, and it was comfortable. Most had to learn basic computer skills first before even beginning to use the GIS.
“We overcame their objections by getting users involved at every level — motivating them, providing management support, promoting communication, and working together to create a user-friendly application. Because we did this, GIS is now a common tool essential to all employees’ daily work.”
The department had numerous goals for its GIS and took the time necessary to implement them methodically and to convert its paper data accurately to the computerized system. The entire process took about two years to complete, with the assistance of an outside consulting firm, Geonex, which digitized the hard-copy water and sewer system maps with comprehensive attribute databases. About 30 staff members were involved in the GIS database design, as-built record drawings research, and data quality assurance/quality control (QA/QC) during the GIS data conversion.
Evolution of purpose
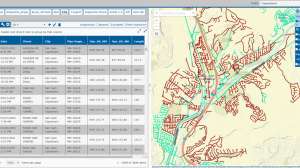
At present, the department has 80 GIS users — managers, engineers, field crews and administrative analysts. All use the system to query and analyze information such as water and sewer system data, locations, conditions, trends and patterns. The information helps them to explore alternatives and create strategies for facility management and specific bureau needs.
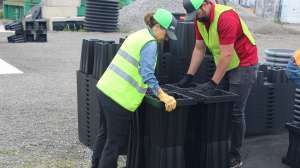
To help keep the GIS data current, the department draws from an aggressive, ongoing CCTV inspection and cleaning program, which covers the entire wastewater collection system — a five-year cycle for inspection and a two-year cycle for cleaning. Five Pearpoint CCTV inspection vehicles carry onboard computers using flexidata pipe survey software by PipeLogix Inc. The crews perform mainline, lateral and manhole inspection using the NASSCO PACP (Pipeline Assessment and Certification Program), LACP (Lateral Assessment and Certification Program) and MACP (Manhole Assessment and Certification Program) standards.
Each installation of the survey software also includes a GIS module that gives the CCTV operators a visual aid in selecting the pipe to survey and imports the asset details directly from the GIS databases. As the crews progress with inspections, surveyed pipes are auto-selected and highlighted to let team members know which pipes have been completed.
“Out in the field, having GIS incorporated into the survey process has made my life a lot easier,” says Chris Blevins, water utility mechanic III in the CCTV Group, Sewer Operations. “With the map system on the truck, I can go directly to the GIS map through software, highlight the pipe I’m about to televise, and create my survey. It will automatically populate the manhole names, their numbers, the depths, what material it is and any other information that is available.”
“Once I’ve completed the survey, I can download that to our server. Then anybody can take it and, at their fingertips, click to select that pipe and retrieve my information. Then they can go through and highlight that line as a grease problem, as a root problem, or for cracks and other defects. That helps them create a plan of action for maintenance or rehabilitation.”
As the department performs various inspections, maintenance tasks and repairs, all the information is fed to the GIS. This led to a GIS system that contains more than 100 data layers. For its potable water and reclaimed systems, items such as mains, valves, hydrants, meters, cathodic protection and vaults are recorded. Wastewater collection system layers include mains, flow direction, manholes, cleanouts, pump stations, grease traps, as-built drawings, sewer spill history, laterals and others. Other layers, such as lots, assessor parcels, flood zones, gas pipelines, census data and aerial photos, round out the data elements.
Charting the course
All this data helps the Engineering Bureau chart the utility’s course for capital improvements, maintenance scheduling, and operational improvements of the systems.
“The GIS system has created a common platform,” says Chris Wilkerson, sewer operations superintendent. “By using standardized coding like PACP and then having all of that data in one area, in a single format and platform, the CCTV crews and Engineering Bureau can review the data together, communicate and have a common understanding of the condition of the system. Then we can work together to prioritize what assets need to be maintained, rehabilitated or replaced, how they should be dealt with and when.”
The system also maps preventive maintenance tasks and aids in scheduling. For example, maps are highlighted in special colors from manhole to manhole, indicating which lines have experienced sanitary sewer overflows (SSOs) or need cleaning more frequently. These highlights help in creating 90-, 120- or 180-day repeat lists for the cleaning crews.
Highlights are also created for the system’s inverted siphons. “Our crews are able to look up the highlights and go straight to them instead of fumbling around, trying to locate these points on a regular hard map,” says Wilkerson. “By being able to get to this information easily, we can extract specific maps, create a ‘book’ for the crew. Then they can deploy to exactly where they need to be in the city quickly.”
Eventually, all of the field crews and trucks will be equipped with portable computers and the GIS data. The goal is to create a paperless field process. “There was some resistance to this idea at first, but now that some of the crews have tried it, they really like it, especially not having to refer to the heavy, hard-copy maps in their trucks anymore,” says Wilkerson.
Special programs and uses
The GIS has made a significant contribution to the success of the department’s capital improvement program. During the past 10 years, the department has invested nearly $90 million to replace its cast-iron water mains (as much as 107,000 linear feet per year) with ductile-iron mains. The Engineering Bureau has been using GIS to track and analyze main breaks. To identify and prioritize main replacements, engineers capture and analyze data on main breaks over a 20-year period.
A special GIS application calculates main-break frequency on an individual pipe and then lists the pipes in descending order from high- to low-break frequency. This list helps the engineer formulate and define more specific criteria to locate the mains with highest break tendencies and outline pipe replacement schedules for the coming five years. As a result, main breaks have been reduced from 160-180 per year (in the early 1990s) to 20-30 per year.
Never one to rest on its laurels, the department is developing a new FOG prevention program. Using its GIS, the staff has created special databases to track sewage spills by location, cause, estimated size, sewer manhole number, and other criteria, along with citywide food businesses and grease interceptor locations.
Engineering Bureau and Sewer Operations staff members use the GIS to identify all food businesses with or without grease interceptors. After a SSO, the detailed information in the FOG database is available to the CCTV crews so they can use an incident follow-up inspection to pinpoint the source of the FOG that contributed to the overflow. Armed with this detailed information, the department can take the proper enforcement measures and minimize future maintenance costs caused by FOG.
The technology also helps ona more personal level. “GIS is an extremely useful tool for us in new employee training,” says Isaac Pai, director of engineering/chief engineer. “When an engineer or field crew member comes on board, we use GIS to help them learn and understand our systems. The simple access and unified visual format provides them an easy way to see the entire water and wastewater systems — how they are laid out and how all the components work together.”
Coming full circle
In many cities similar in size to Long Beach, GIS is just one component of a larger asset management system. In Long Beach, GIS is the asset management program. By involving staff from all bureaus and levels of expertise, the Engineering Bureau and GIS staff has taken the technology beyond its original purpose, eliminating the need for an additional costly program.
The system is constantly being improved and expanded to offer all bureaus ways to increase productivity, improve decision-making, and expand capabilities to perform large tasks previously thought impractical. Like an asset management program, it has also improved records management and accessibility, reduced redundant data, and saved time and money.
By being unafraid to push the boundaries of GIS technology, the Long Beach Water Department has created a showcase for GIS professionals around the world and shows how technology can point the way to successful data management and high-performing water and wastewater systems.
Continue reading for free