For Pasadena Water, GIS is more than just a mapping tool. It has become a strategic platform for operational efficiency and organizational communication.
Pasadena Water and Power provides water service to nearly 38,000 households and businesses in Pasadena, California. The utility also serves customers in several surrounding communities including Altadena, San Marino and San Gabriel. Mapping all its assets is critical, but that’s only the start.
Real-time performance
Before 2023, water main break incidents were documented using handwritten paper forms. Recognizing the need for modernization, PWP developed the Main Break GIS Solution to track, visualize and analyze break incidents across the water distribution system.
Field crews capture main break details directly in a mobile GIS application including incident time, pipe material, meter size and pressure zone. The information is stored in the enterprise GIS system and is made immediately available to executives, engineers and supervisors. The process has significantly expanded analytical capabilities, enabling engineers to visualize asset relationships throughout the water distribution network. Executives leverage ArcGIS Dashboards (Esri) to monitor system performance and make strategic decisions based on key performance indicators.

This modernized approach helps PWP identify system vulnerabilities, prioritize capital improvements and optimize overall system performance.
Complaint mapping
In the past, water quality complaints were manually tracked in Excel spreadsheets. In May 2023, the water quality team requested a GIS solution to map, document and respond to customer’s concerns.
To support this effort, a dynamic donut chart symbol was designed to represent cases with single or multiple complaint types. Water quality managers, engineers and laboratory scientists analyze complaints by month, year or combined categories. Based on the analysis, PWP can identify spatial patterns during their investigations of complaint clusters and ultimately dispatch UDF trucks for targeted flushing.
“GIS-based solutions have transformed how I manage our Unidirectional Flushing Program,” says associate engineer Isabel Ellis.
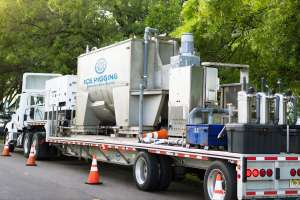
During unidirectional flushing operations, field crews close valves to isolate pipeline sections, then use the UDF truck to connect two hydrants to form a controlled flushing loop to remove contaminants. All of this requires planning and documentation. To innovate this workflow, the UDF GIS Solution was developed to support digital planning, execution and monitoring.

“When I was originally trained, this was all done by printing maps and marking them by hand, but now I can complete the process from start to finish using GIS-based solutions,” Ellis says. “I can quickly identify areas that need flushing using the built-in water quality complaint data, adjust plans directly on the GIS app as I plan, and pull all the pipe and valve data I need.”
Each UDF project is mapped, including the flushing area, associated hydrants, pipelines and valves that need to be opened or closed during the process. Field teams execute plans using mobile applications while engineers and supervisors track progress through live maps, applications, dashboards and analytics tools.
This integrated workflow has significantly improved operational efficiency and response times, enhanced monitoring and increased community confidence in Pasadena’s water quality management.
“With our new GIS Solutions, we can finally keep track of our Water Quality Complaint and Unidirectional Flushing Program records in a map-based system that allows us to easily see which areas can benefit most by flushing,” says Myriam Cardenas, water quality adviser. “This allows us to work in a more efficient and targeted manner. These GIS applications also allow us to access historical records quickly and can help us to determine how frequently maintenance should be performed or if main replacement is warranted.”
Central access
At the heart of Pasadena’s efforts is GIS Express, an integrated suite of comprehensive GIS solutions powered by ArcGIS Hub, ArcGIS Experience Builder, ArcGIS Dashboards, ArcGIS StoryMaps and other modern web frameworks. It is a centralized, accessible and innovative platform that enhances infrastructure management, supports field operations and increases public transparency across the Pasadena Water Division. This allows internal teams, cross-organizational partners and the public to understand active projects, proposed plans and historical records related to Pasadena Water.

The hub delivers real-time insights into key Pasadena Water projects, including water main break analysis, water quality reporting, unidirectional flushing operations, turf rebate water conservation programs and 3D asset management vision. Managers, engineers and field crews use the GIS platform to share insights, coordinate work and address operational challenges.
The Hub supports cross-organizational collaboration by bringing other departments together to coordinate the city’s infrastructure projects. A notable example is the Main Replacement and Street Resurfacing Partnership between PWP and Public Works departments. By planning and visualizing water system upgrades and street resurfacing together, both departments can better align schedules, reduce construction conflicts and minimize impacts to the community.
By making GIS more accessible and increasing user engagement, the Hub has become essential to fulfilling PWP’s mission of creating public value and enhancing operational effectiveness.
Community forward
The GIS Hub functions as both a communication and outreach channel across the community and the organization.
“Most recently, we used GIS to develop an overview dashboard for all of the turfgrass replacement projects within Pasadena,” says Jessica Hernandez, senior customer program analyst. “This allows us to better understand who is participating in our programs, where they live, and where to target our outreach efforts. It also has a public-facing component, which we can share with residents and elected officials to allow them to see how our community has transformed over time.”

The Hub has also served as a public gateway for sharing emergency updates such as Do Not Drink Water Advisories in the affected areas during the Eaton Fire incident in January 2025. That incident highlighted the critical role of GIS in emergency response and public communication. The fire damaged reservoirs, tanks and pump stations in foothill areas of Pasadena and Altadena, raising potential water quality attention.
Within 48 hours, the PWP GIS team deployed a Do Not Drink Water Advisory application, allowing residents to search by address and view real-time service impacts. By the end of January, the application and its shared web layers had received more than 23 million views, largely due to active promotion by executive leadership and department staff, as well as the PWP website, social media, news outlets and customer communications channels.
This response demonstrated how GIS can deliver emergency awareness to the public through a real-time, visual and efficient process.
Visualizing the future
The primary value of 3D GIS lies in visualizing vertical separation between water mains and adjacent below-grade utilities, including sewer mains, storm drains, electrical, gas, cable and other underground infrastructure.
Pasadena is utilizing 3D spatial visualization to support the design and coordination of water infrastructure in dense urban environments. Engineers can better evaluate alignments, depths and clearances within congested utility corridors when designing new water mains and replacing aged ones.
Rather than a standalone technology, PWP is using GIS as a comprehensive and enterprise platform. By centralizing data, enabling real-time workflows and supporting cross-department coordination, GIS increases operational awareness and enhances decision-making at many levels of the organization.
As PWP continues to modernize its infrastructure, the platform is providing a scalable foundation to support resilience, transparency and reliable service to the community.
“GIS has been a transformative force for Pasadena Water and Power,” says Jeremy Marquette, PWP assistant general manager. “It has modernized how we visualize our infrastructure, coordinate fieldwork, and make informed operational decisions. By delivering real-time insights and enhancing collaboration across our utility divisions, GIS is helping us provide safer, more reliable, and more efficient service to the Pasadena community.”
Owen Mo is a member of the Pasadena Water & Power GIS Team.
Continue reading for free