Like many utilities, the city of Bellevue, Washington, cleaned its sewers on a routine schedule for years. A line was jetted every six months, or every quarter, because that was the interval it had always been on. The frequencies came from history and habit more than from any measurables.
Collection system cleaning generally falls into two categories, scheduled and reactive, and Bellevue’s program was mostly the first, set years earlier and left in place.
But how does a utility know the intervals are right? Guessing carries a cost in both directions. Clean too rarely and blockages follow, along with the emergency callouts they trigger. Overclean and the cost is with crew hours spent on lines that were already clear, plus wear on pipe that did not need it. With wastewater infrastructure still graded a D-plus on the 2025 ASCE Report Card, and crews stretched thin, neither cost is easy to carry.
Bellevue set out to take the guesswork out of its program, starting with the lines that generated the most work.
A schedule built on habit
The city’s collection system runs to about 600 miles of mainline. It is monitored by a single wastewater senior engineer technician, with four crew members handling the fieldwork day to day.
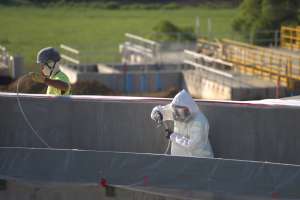
The cleaning program Bellevue had inherited ran on fixed intervals with no data behind them. Some lines were jetted as often as once per month. In total, roughly 255,000 feet of pipe went through recurring cleaning each year, and at about $0.98 per foot that came to close to $250,000 annually. When buildup did cause a problem between scheduled cleans, the team usually learned of it from a resident before catching it themselves.
Measuring the real interval
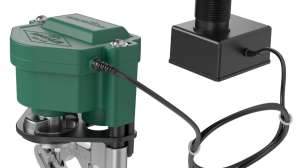
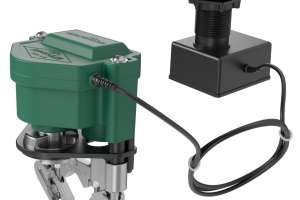
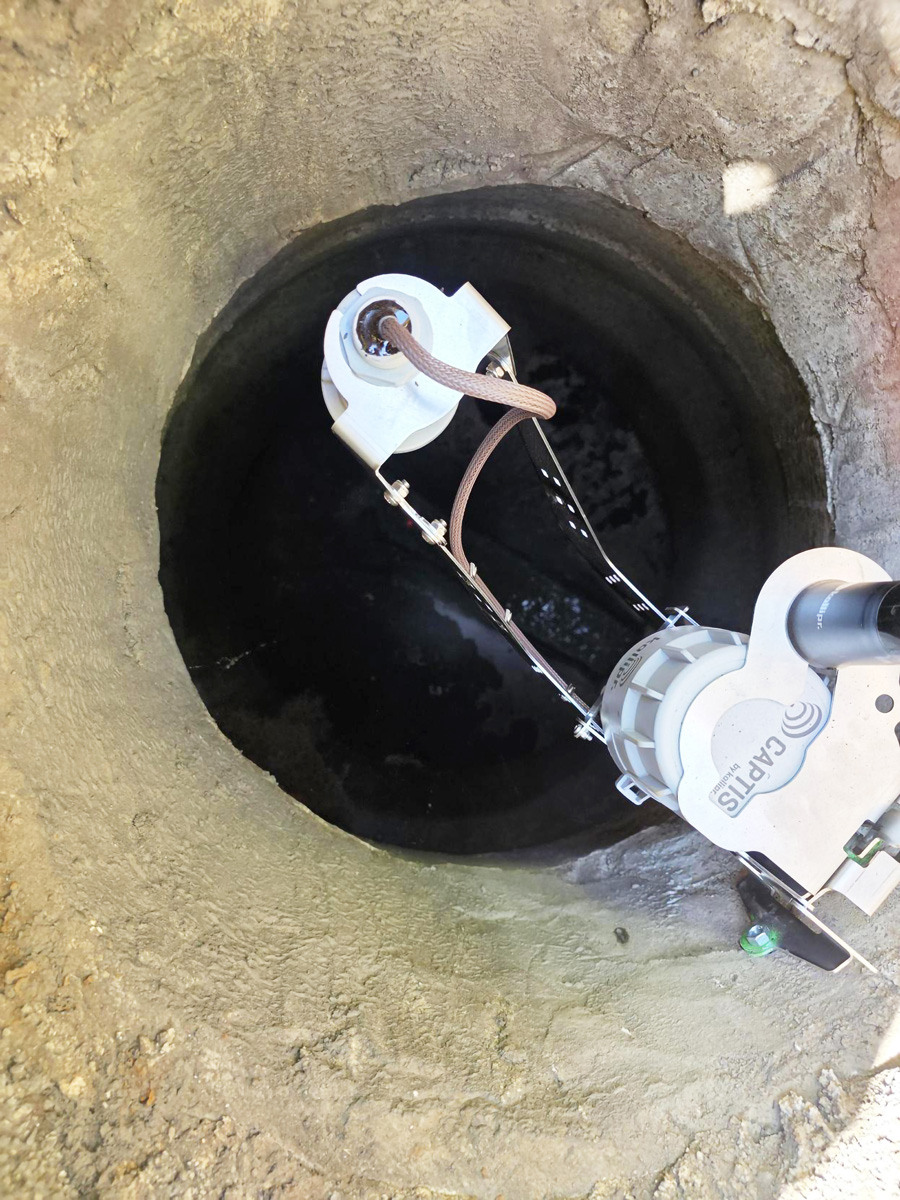
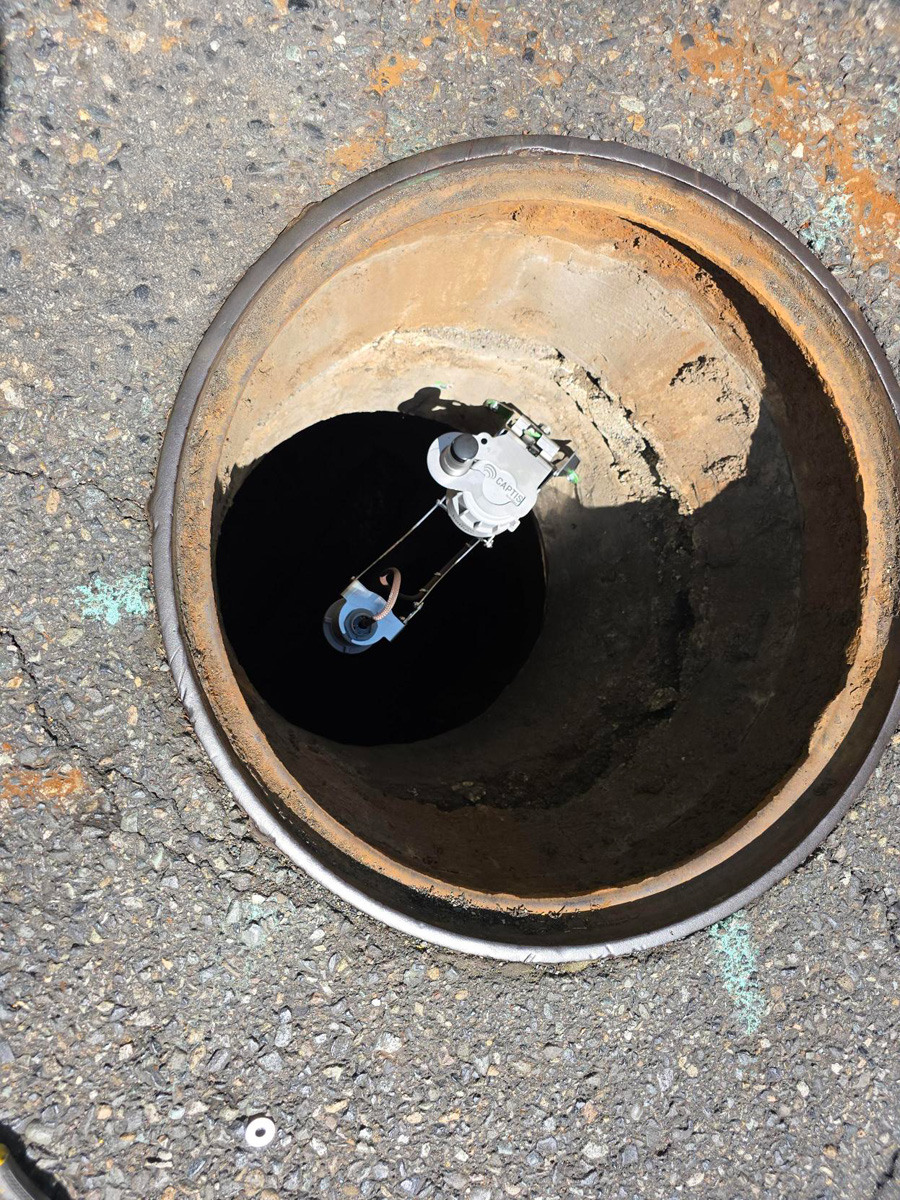
Rather than keep adjusting frequencies by feel, Bellevue decided to measure them. The city installed the Kallipr Captis Sewer Level Monitoring Solution on the assets with the heaviest maintenance history. Each kit pairs a Captis S2 edge device with a Kallipr Radar Sensor that reads liquid level continuously without contacting the flow, which lets the city place the sensors on live, high-maintenance lines without confined-space entry or any modification to the pipe.
The method that followed is deliberately simple. A line is cleaned, then left under a sensor so the level data can show how long it takes for buildup to return and begin restricting flow. That measured interval, specific to the asset, becomes the basis for the next cleaning, in place of the figure carried over from the old calendar. The readings feed into the Kallipr Kloud platform, where the team can follow a line’s behavior across weeks and months instead of inferring it from the occasional site visit.
Establishing a reliable interval for a single asset can take several months of continuous data.
What the data revealed
The early findings ran counter to how the program had always operated. On the assets reassessed so far, Bellevue has extended cleaning from every six months to once a year, and the lines that had been jetted monthly are next for the same review. Those reassessed lines have held the longer interval without incident.
The clearer message was that the city had been cleaning more often than its network required, and that overmaintenance was costing Bellevue twice. It consumed the limited time of the crew responsible for the entire system, and it added wear to pipe that was otherwise sound. Repeated high-velocity jetting scours at pipe walls, so each unnecessary pass was quietly shortening the service life of an asset the program was meant to protect.
The sensors also revealed other behavior. At two locations, flow rises in the early hours of the morning, a period when a collection system should be near its quietest. That kind of pattern does not appear on a cleaning calendar and would never have reached the city as a complaint. With it on record, Bellevue can investigate what is driving it.
Moving a line from a six-month cleaning schedule to annual cleaning takes it from two passes per year to one, and every pass the data takes off the schedule is a crew visit that doesn’t have to happen. On a four-person operation that adds up quickly, and those hours can be directed toward work that actually needs doing. The result is a crew that can cover more of the network at the interval each line needs, without adding people.
A model for stretched utilities
Bellevue’s circumstances are common across the sector. Many utilities are operating aging collection systems with fewer staff than the networks realistically demand, under steady budget and regulatory pressure. Under that strain, the path of least resistance is to keep cleaning on the established calendar and trust the intervals are close enough.
Bellevue’s experience suggests the calendar is often wrong, which can be costly. Measuring the true interval on the assets that drive the most maintenance turns a fixed schedule into one the utility can defend with data, and it lets a small crew direct its hours toward the parts of the network that genuinely need attention. The same record supports every cleaning decision, including the decision to leave a line alone.
The work is ongoing. The sensors continue to move through Bellevue’s network, establishing one interval at a time, and the schedule that emerges will be one the city has measured rather than inherited.
Richard Peckler is the wastewater senior engineer technician for the city of Bellevue, Washington, where he is responsible for the operation and maintenance of the city’s sanitary sewer collection system.
Continue reading for free